Technical Analysis of BYRE 2024-05-10
Overview:
In analyzing the technical indicators for BYRE over the last 5 days, we will delve into the trend, momentum, volatility, and volume indicators to provide a comprehensive outlook on the possible stock price movement in the coming days. By examining these key aspects, we aim to offer valuable insights and predictions for potential investors.
Trend Analysis:
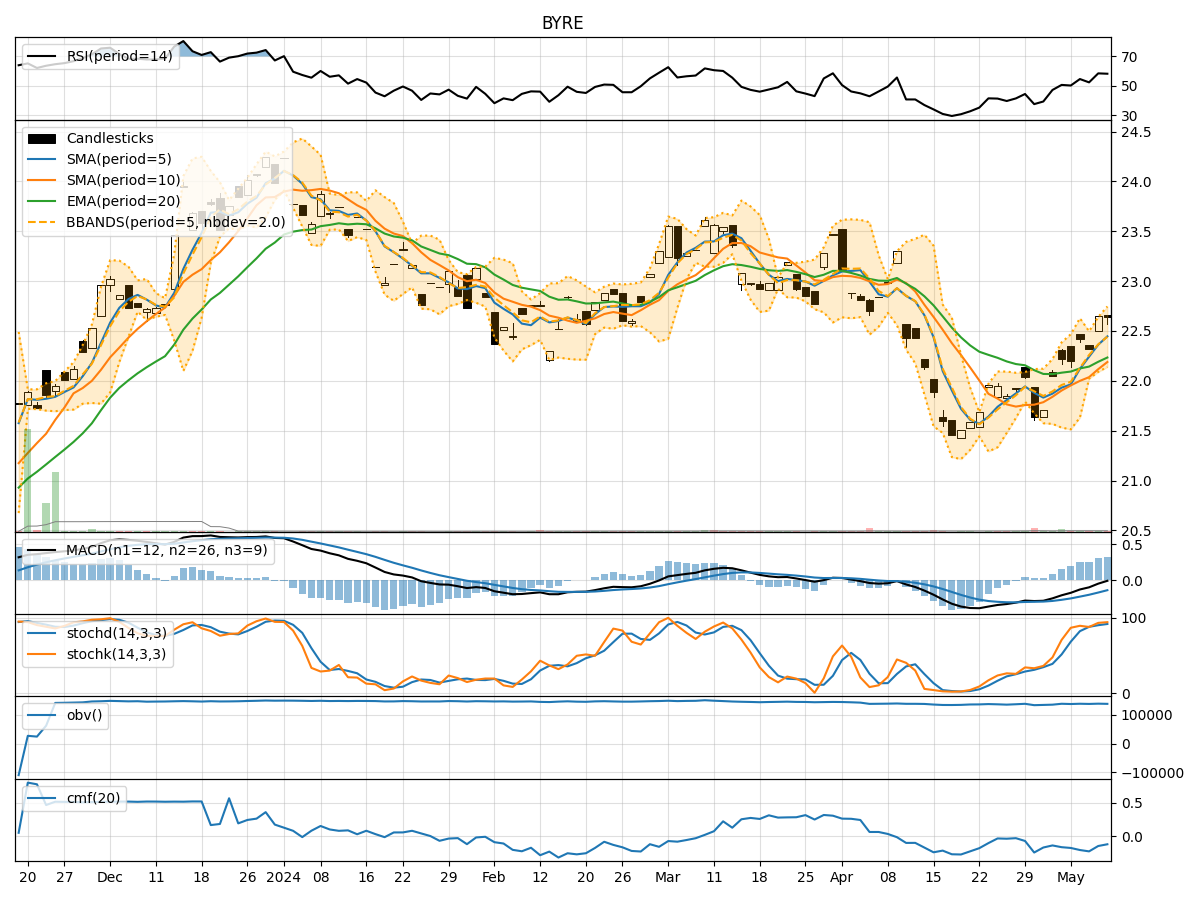
- Moving Averages (MA): The 5-day MA has been consistently above the closing prices, indicating a short-term uptrend.
- MACD: The MACD line has been below the signal line, suggesting a bearish momentum.
- RSI: The RSI has been fluctuating around the 50 level, indicating a neutral sentiment.
Momentum Analysis:
- Stochastic Oscillator: Both %K and %D have been in overbought territory, signaling a potential reversal.
- Williams %R: The indicator has been hovering around oversold levels, suggesting a possible buying opportunity.
Volatility Analysis:
- Bollinger Bands (BB): The stock price has been trading within the bands, indicating a period of consolidation.
- BB Percentage (BBP): The BBP has been fluctuating, reflecting the volatility in the stock.
Volume Analysis:
- On-Balance Volume (OBV): The OBV has been negative, indicating selling pressure in the stock.
- Chaikin Money Flow (CMF): The CMF has been consistently negative, suggesting outflow of money from the stock.
Conclusion:
Based on the analysis of the technical indicators, the stock of BYRE is likely to experience further downside movement in the coming days. The bearish signals from the MACD and Stochastic Oscillator, coupled with the negative OBV and CMF, indicate a strong selling pressure on the stock. Additionally, the RSI hovering around the neutral level and the Williams %R indicating a potential buying opportunity do not provide enough support for a bullish reversal.
Therefore, investors should exercise caution and consider waiting for more definitive signals before considering any long positions. The stock is currently in a bearish trend with a high probability of continued downward movement. It is advisable to closely monitor the price action and key support levels for potential entry or exit points.
Key Takeaway:
- Bearish Outlook: The technical indicators suggest a bearish sentiment in the stock.
- Caution Advised: Investors should wait for clearer signals before making any trading decisions.
- Monitor Closely: Keep a close eye on the price action and key support levels for strategic entry or exit points.