Technical Analysis of CACG 2024-05-10
Overview:
In analyzing the technical indicators for CACG stock over the last 5 days, we will delve into the trend, momentum, volatility, and volume indicators to provide a comprehensive outlook on the possible stock price movement in the coming days. By examining these key indicators, we aim to offer valuable insights and recommendations for potential investors.
Trend Indicators:
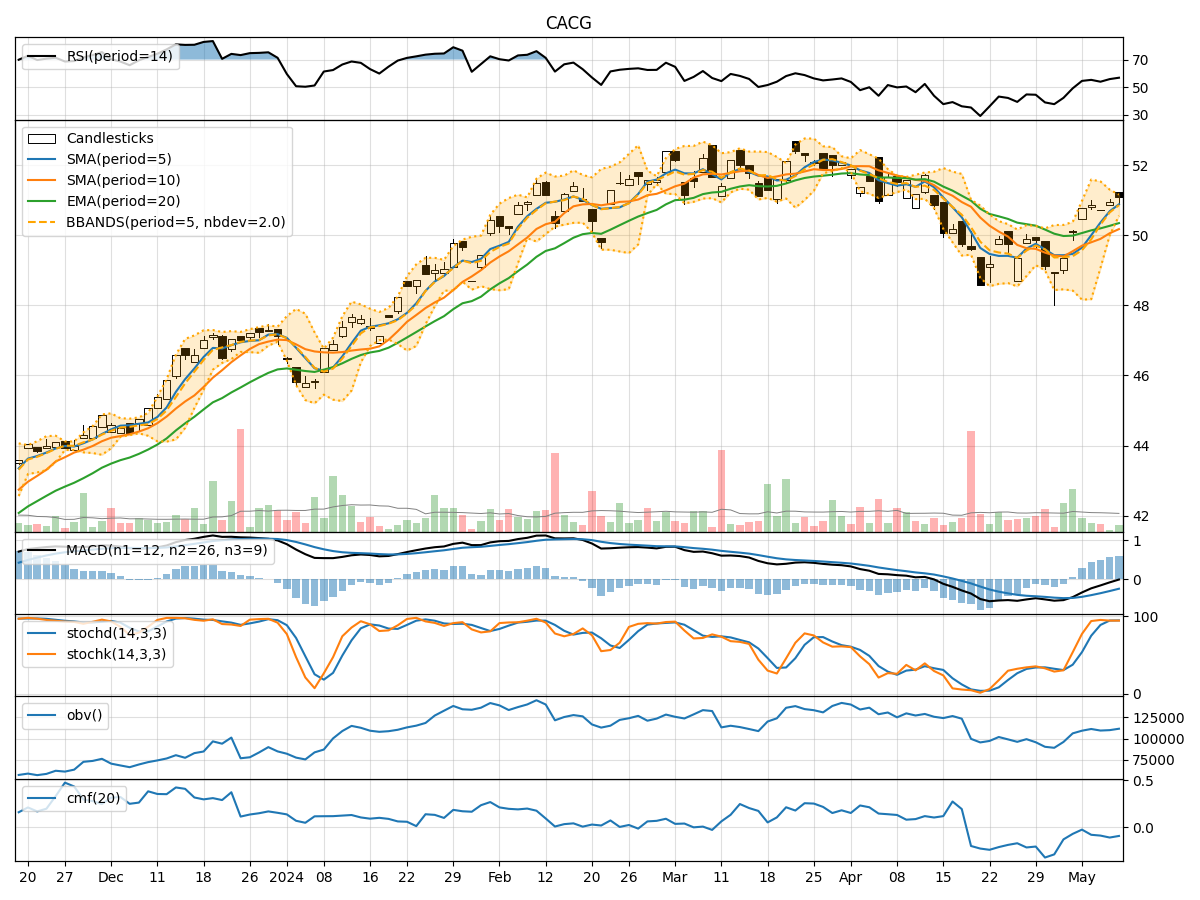
- Moving Averages (MA): The 5-day Moving Average (MA) has been consistently above the Simple Moving Average (SMA) and Exponential Moving Average (EMA), indicating a bullish trend.
- MACD: The MACD line has been below the signal line, suggesting a bearish momentum in the short term.
- MACD Histogram: The MACD Histogram has been gradually decreasing, indicating a weakening bearish momentum.
Momentum Indicators:
- RSI: The Relative Strength Index (RSI) has been in the overbought territory, suggesting a potential reversal or consolidation.
- Stochastic Oscillator: Both %K and %D have been in the overbought zone, indicating a possible upcoming bearish reversal.
- Williams %R: The Williams %R has been in the oversold region, signaling a potential bullish reversal.
Volatility Indicators:
- Bollinger Bands (BB): The stock price has been trading within the Bollinger Bands, with the bands narrowing, indicating decreasing volatility.
- Bollinger %B: The %B indicator has been hovering around 0.8, suggesting a bullish sentiment.
Volume Indicators:
- On-Balance Volume (OBV): The OBV has been showing a slight decrease, indicating a potential distribution phase.
- Chaikin Money Flow (CMF): The CMF has been negative, signaling a bearish money flow trend.
Key Observations and Opinions:
- Trend: The trend indicators suggest a bullish bias in the short term, supported by the moving averages. However, the MACD signals a weakening momentum.
- Momentum: The momentum indicators are mixed, with RSI signaling a potential reversal, while Stochastic and Williams %R indicate conflicting signals.
- Volatility: Volatility has been decreasing, which could lead to a period of consolidation or a breakout in the near future.
- Volume: The volume indicators show a slight decrease in buying pressure, which may impact the stock price movement.
Conclusion:
Based on the analysis of the technical indicators, the stock price of CACG is likely to experience sideways consolidation in the coming days. While the trend indicators suggest a bullish bias, the weakening momentum and mixed signals from the momentum indicators indicate a possible reversal or consolidation. The decreasing volatility and slight decrease in buying pressure further support the view of sideways movement. Investors should closely monitor key support and resistance levels for potential breakout opportunities.