Technical Analysis of CALY 2024-05-10
Overview:
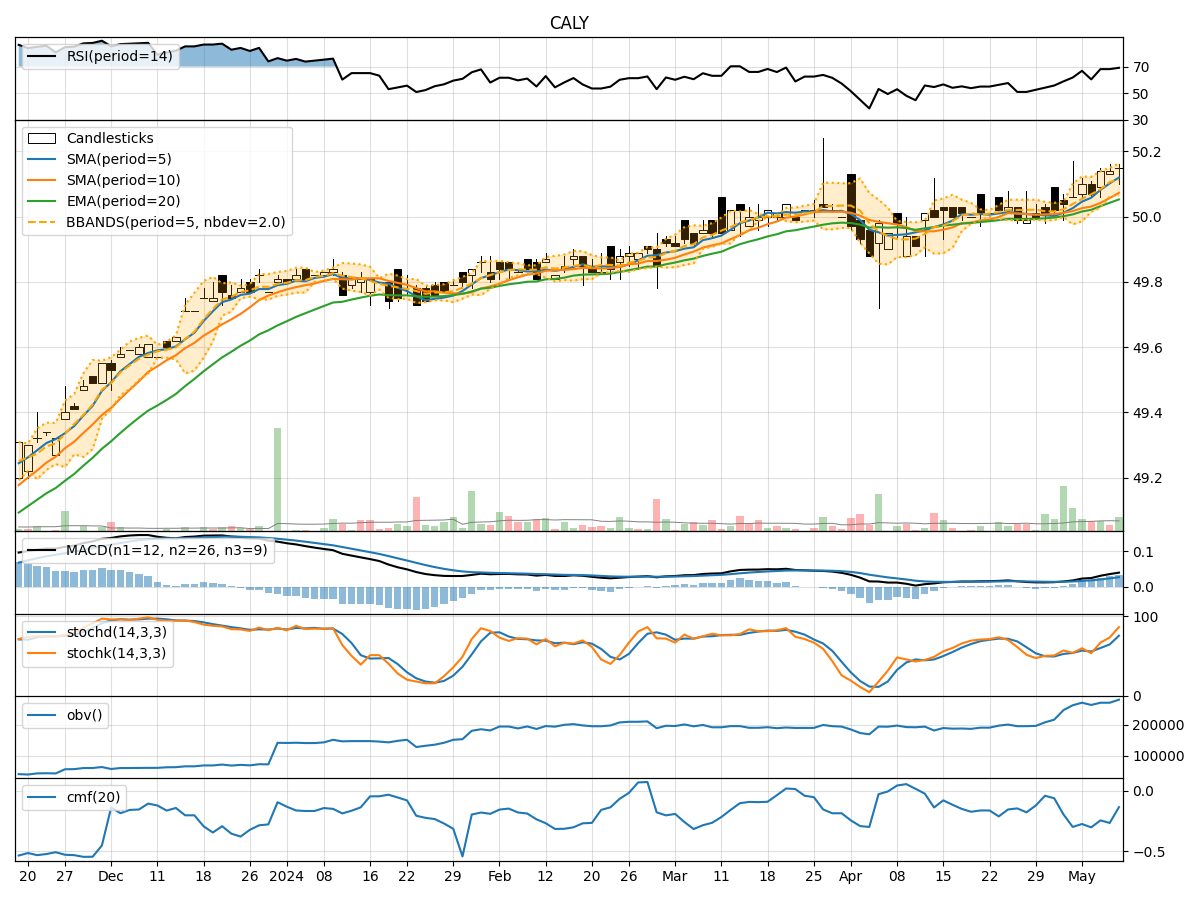
In analyzing the technical indicators for CALY over the last 5 days, we will delve into trend, momentum, volatility, and volume indicators to provide a comprehensive outlook on the possible stock price movement in the coming days.
Trend Indicators:
- Moving Averages (MA): The 5-day Moving Average has been consistently above the Simple Moving Average (SMA) and Exponential Moving Average (EMA), indicating a bullish trend.
- MACD: The MACD line has been consistently above the signal line, with both lines showing an upward trend, suggesting bullish momentum.
- Conclusion: The trend indicators point towards an upward trend in the stock price.
Momentum Indicators:
- RSI: The Relative Strength Index (RSI) has been fluctuating around the overbought territory, indicating strong buying momentum.
- Stochastic Oscillator: Both %K and %D lines of the Stochastic Oscillator have been in the overbought zone, suggesting a strong bullish momentum.
- Conclusion: Momentum indicators signal a strong bullish sentiment in the stock.
Volatility Indicators:
- Bollinger Bands (BB): The stock price has been trading within the upper Bollinger Band, indicating high volatility.
- Conclusion: Volatility indicators suggest high volatility in the stock price.
Volume Indicators:
- On-Balance Volume (OBV): The OBV has been relatively stable, indicating consistent buying pressure.
- Chaikin Money Flow (CMF): The CMF has been negative, suggesting some selling pressure in the stock.
- Conclusion: Volume indicators show mixed signals with stable buying pressure but negative CMF.
Key Observations and Opinions:
- Trend: The trend indicators strongly suggest an upward trend in the stock price.
- Momentum: Momentum indicators reflect a strong bullish sentiment with overbought conditions.
- Volatility: High volatility is observed in the stock price based on Bollinger Bands.
- Volume: While OBV indicates buying pressure, the negative CMF signals some selling pressure.
Conclusion:
Based on the analysis of technical indicators, the next few days' possible stock price movement for CALY is likely to be upward with strong bullish momentum. However, the high volatility and mixed volume signals indicate the need for cautious monitoring of the stock. Traders and investors should consider capitalizing on the bullish trend but remain vigilant for any signs of reversal or increased selling pressure.