Technical Analysis of CAMX 2024-05-10
Overview:
In analyzing the technical indicators for CAMX over the last 5 days, we will delve into the trend, momentum, volatility, and volume indicators to provide a comprehensive outlook on the possible stock price movement in the coming days. By examining these key aspects, we aim to offer valuable insights and predictions for potential investors.
Trend Analysis:
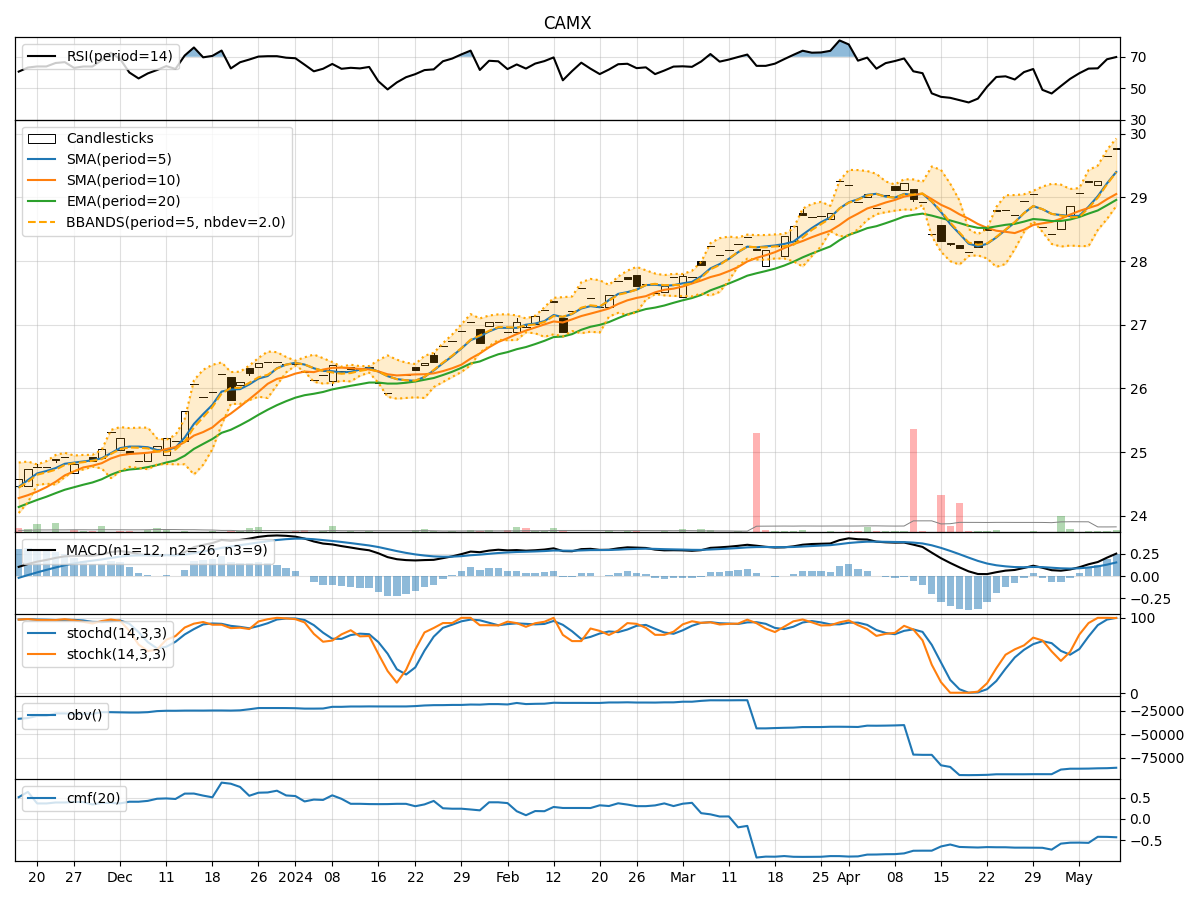
- Moving Averages (MA): The 5-day Moving Average (MA) has been consistently above the Simple Moving Average (SMA) and Exponential Moving Average (EMA), indicating a bullish trend.
- MACD: The MACD line has been above the signal line, with both lines showing an upward trend, suggesting bullish momentum.
Momentum Analysis:
- RSI: The Relative Strength Index (RSI) has been increasing and is currently in the overbought territory, signaling strong buying momentum.
- Stochastic Oscillator: Both %K and %D have been near or at 100, indicating strong upward momentum.
Volatility Analysis:
- Bollinger Bands (BB): The stock price has been consistently trading above the middle Bollinger Band (BBM), suggesting an uptrend with low volatility.
Volume Analysis:
- On-Balance Volume (OBV): The OBV has been decreasing, indicating a divergence between price and volume, which could be a cause for concern.
- Chaikin Money Flow (CMF): The CMF has been negative, reflecting selling pressure in the stock.
Key Observations:
- The trend indicators suggest a strong bullish sentiment in the stock.
- Momentum indicators indicate significant buying pressure and potential overbought conditions.
- Volatility remains relatively low, indicating a stable uptrend.
- Volume indicators show a divergence between price and volume, which could be a red flag for potential reversal.
Conclusion:
Based on the analysis of the technical indicators, the next few days' possible stock price movement for CAMX is likely to continue in an upward direction. However, caution is advised due to the potential overbought conditions indicated by the momentum indicators and the divergence in volume. Investors should closely monitor the price action and consider taking profits or implementing risk management strategies to navigate potential market corrections.