Technical Analysis of CANE 2024-05-10
Overview:
In analyzing the technical indicators for CANE over the last 5 days, we will delve into the trend, momentum, volatility, and volume indicators to provide a comprehensive outlook on the possible stock price movement in the coming days. By examining these key aspects, we aim to offer valuable insights and predictions for potential investors.
Trend Indicators:
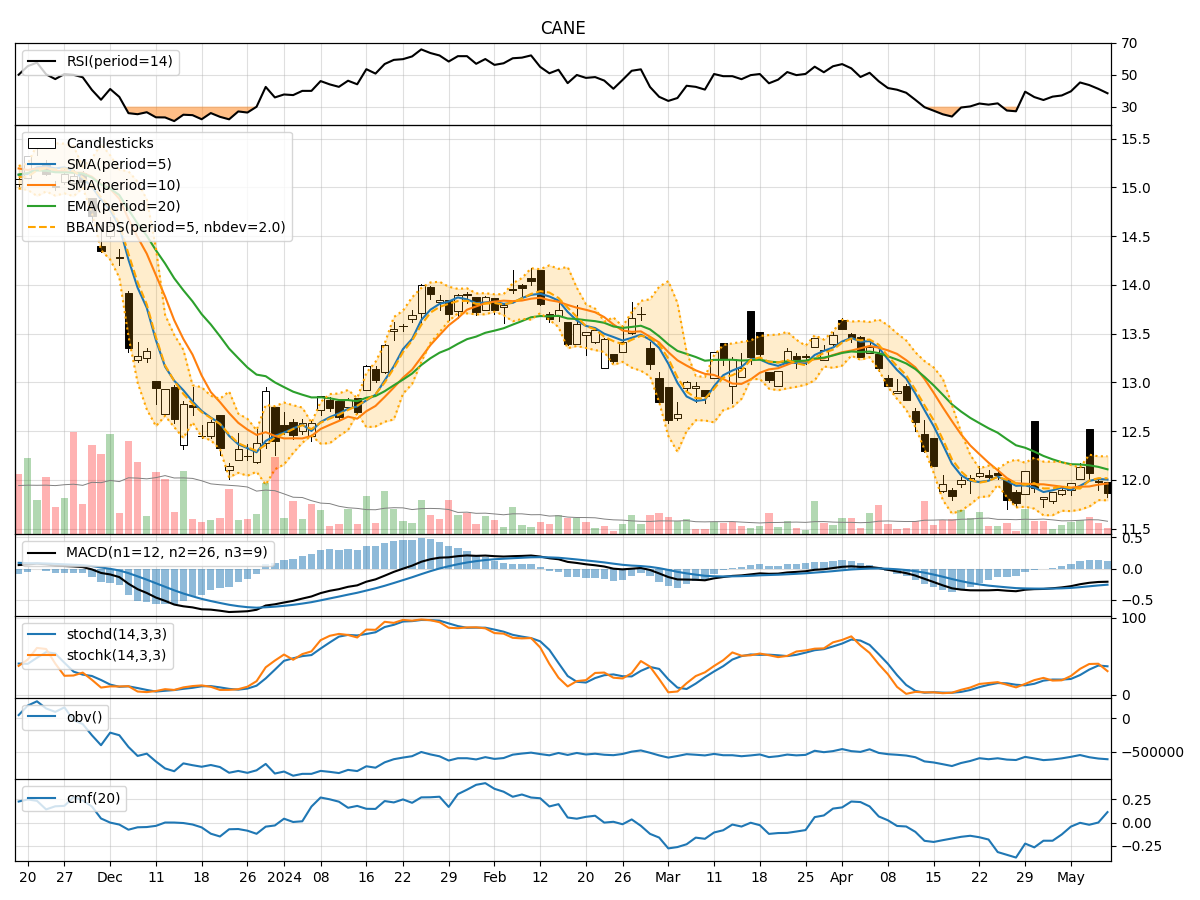
- Moving Averages (MA): The 5-day Moving Average (MA) has been fluctuating around the closing prices, indicating short-term price trends. The Simple Moving Average (SMA) and Exponential Moving Average (EMA) show a downward trend, suggesting a bearish sentiment.
- Moving Average Convergence Divergence (MACD): The MACD and Signal line have been negative, with the MACD Histogram showing a slight decrease. This indicates a weakening trend momentum.
Momentum Indicators:
- Relative Strength Index (RSI): The RSI has been declining, indicating a decrease in buying pressure and potential oversold conditions.
- Stochastic Oscillator: Both %K and %D have been trending downwards, suggesting a bearish momentum.
- Williams %R (Willams %R): The Williams %R is in the oversold territory, signaling a potential reversal or continuation of the downtrend.
Volatility Indicators:
- Bollinger Bands (BB): The Bollinger Bands have been narrowing, indicating decreasing volatility. The price has been trading close to the lower band, suggesting a possible oversold condition.
- Bollinger %B (BB %B): The %B is near the lower band, indicating a potential bounce or reversal.
Volume Indicators:
- On-Balance Volume (OBV): The OBV has been negative, suggesting more selling volume than buying volume.
- Chaikin Money Flow (CMF): The CMF has been negative, indicating a lack of buying pressure and potential distribution.
Conclusion:
Based on the analysis of the technical indicators, the stock of CANE is currently in a downtrend with bearish momentum. The narrowing Bollinger Bands and oversold conditions in various momentum indicators suggest a possible reversal or consolidation in the near term. However, the overall sentiment remains bearish due to the negative trends in moving averages, MACD, and volume indicators.
Recommendation:
Considering the current technical outlook, it is advisable to exercise caution and wait for confirmation of a reversal before considering any long positions. Traders may look for potential short-term opportunities based on oversold conditions, but investors should wait for a clear trend reversal before entering or adding to positions. Monitoring key support levels and waiting for bullish signals from momentum indicators would be prudent before considering any bullish positions.