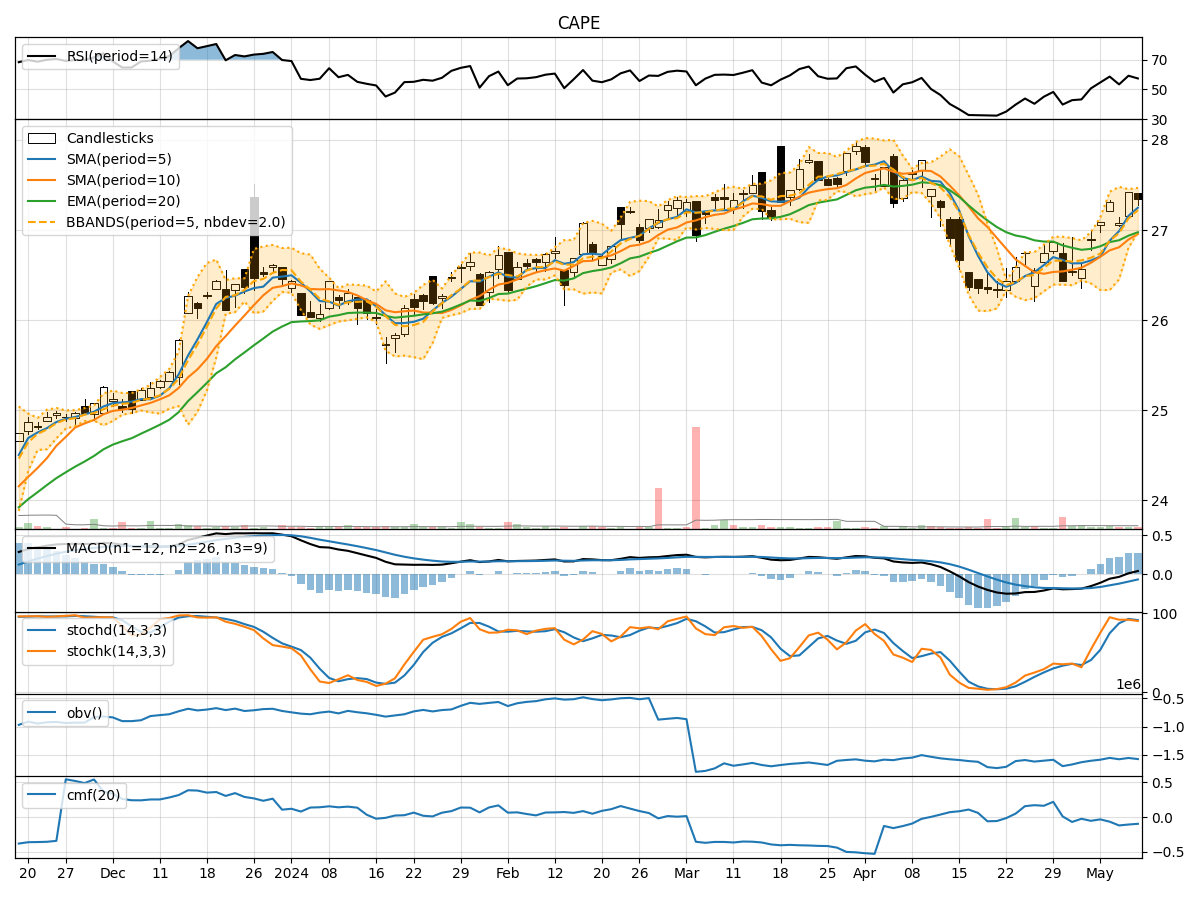
Technical Analysis of CAPE 2024-05-10
Overview:
In the last 5 trading days, the stock price of CAPE has shown some fluctuations. We will analyze the technical indicators in the trend, momentum, volatility, and volume categories to determine the possible future stock price movement.
Trend Indicators Analysis:
- Moving Averages (MA): The 5-day Moving Average (MA) has been above the Simple Moving Average (SMA) and Exponential Moving Average (EMA), indicating a short-term uptrend.
- MACD: The MACD line has been consistently above the signal line, suggesting bullish momentum.
- MACD Histogram: The MACD Histogram has been increasing, indicating strengthening bullish momentum.
Momentum Indicators Analysis:
- RSI: The Relative Strength Index (RSI) has been fluctuating around the 50 level, indicating a neutral momentum.
- Stochastic Oscillator: Both %K and %D have been in the overbought zone, suggesting a potential reversal.
- Williams %R: The Williams %R has been fluctuating around the oversold level, indicating a potential buying opportunity.
Volatility Indicators Analysis:
- Bollinger Bands (BB): The stock price has been trading within the Bollinger Bands, suggesting a period of consolidation.
- Bollinger Band Width: The Band Width has been narrowing, indicating decreasing volatility.
Volume Indicators Analysis:
- On-Balance Volume (OBV): The OBV has been fluctuating, indicating indecision among investors.
- Chaikin Money Flow (CMF): The CMF has been negative, suggesting selling pressure in the stock.
Key Observations and Opinions:
- Trend: The stock is in a short-term uptrend based on moving averages and MACD.
- Momentum: The momentum is neutral to slightly bearish based on RSI and Stochastic Oscillator.
- Volatility: The stock is in a period of consolidation with decreasing volatility.
- Volume: The volume indicators show mixed signals with no clear direction.
Conclusion:
Based on the analysis of technical indicators, the next few days' possible stock price movement for CAPE is sideways consolidation with a slight bearish bias. Investors should closely monitor key support and resistance levels for potential breakout or breakdown scenarios. It is advisable to wait for more confirmation from the indicators before making significant trading decisions.