Technical Analysis of CARD 2024-05-10
Overview:
In analyzing the technical indicators for CARD stock over the last 5 days, we will delve into the trends, momentum, volatility, and volume aspects to provide a comprehensive outlook on the possible stock price movement in the coming days. By examining key indicators such as moving averages, MACD, RSI, Bollinger Bands, and OBV, we aim to offer valuable insights and predictions for potential price trends.
Trend Analysis:
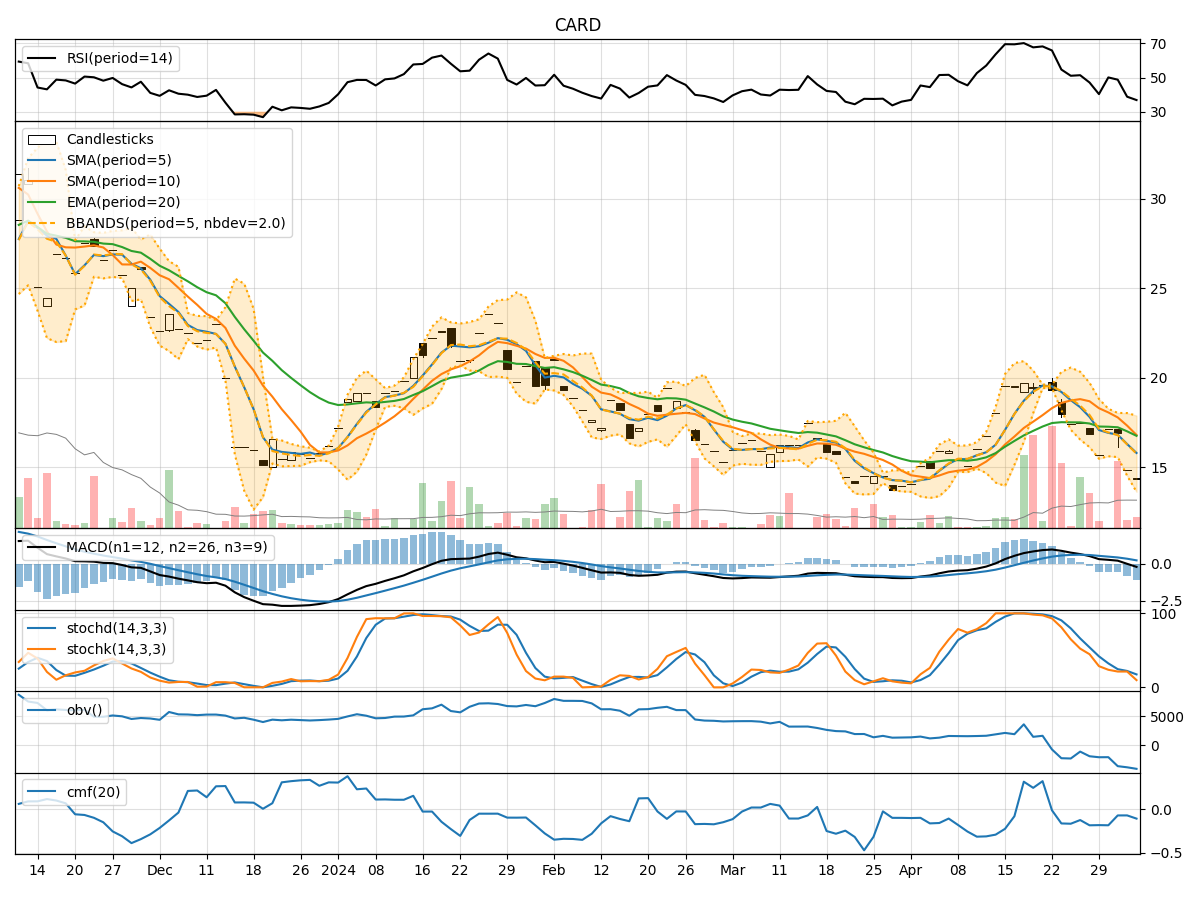
- Moving Averages (MA): The 5-day MA has been consistently below the 10-day SMA, indicating a short-term bearish trend.
- MACD: The MACD line has been below the signal line for the past 5 days, suggesting a bearish momentum.
- EMA: The EMA has been declining, reflecting a downward trend in the stock price.
Momentum Analysis:
- RSI: The RSI has been hovering around 40-45, indicating a neutral to slightly bearish momentum.
- Stochastic Oscillator: Both %K and %D have been below 20, signaling an oversold condition.
- Williams %R: The Williams %R has been consistently below -80, indicating an oversold market.
Volatility Analysis:
- Bollinger Bands (BB): The stock price has been trading below the lower Bollinger Band, suggesting oversold conditions.
- Bollinger Band Width: The BB width has been narrowing, indicating decreasing volatility.
- Bollinger Band %B: The %B has been below 0.2, indicating a potential oversold condition.
Volume Analysis:
- On-Balance Volume (OBV): The OBV has been declining, suggesting selling pressure in the stock.
- Chaikin Money Flow (CMF): The CMF has been negative, indicating a bearish money flow trend.
Conclusion:
Based on the analysis of the technical indicators, the stock of CARD is currently in a bearish phase with oversold conditions. The trend indicators, momentum oscillators, volatility measures, and volume indicators all point towards a potential further downside in the stock price in the coming days. Traders and investors should exercise caution and consider waiting for signs of a reversal or a consolidation phase before considering any long positions. Downward movement is more likely in the near term.