Technical Analysis of CARK 2024-05-10
Overview:
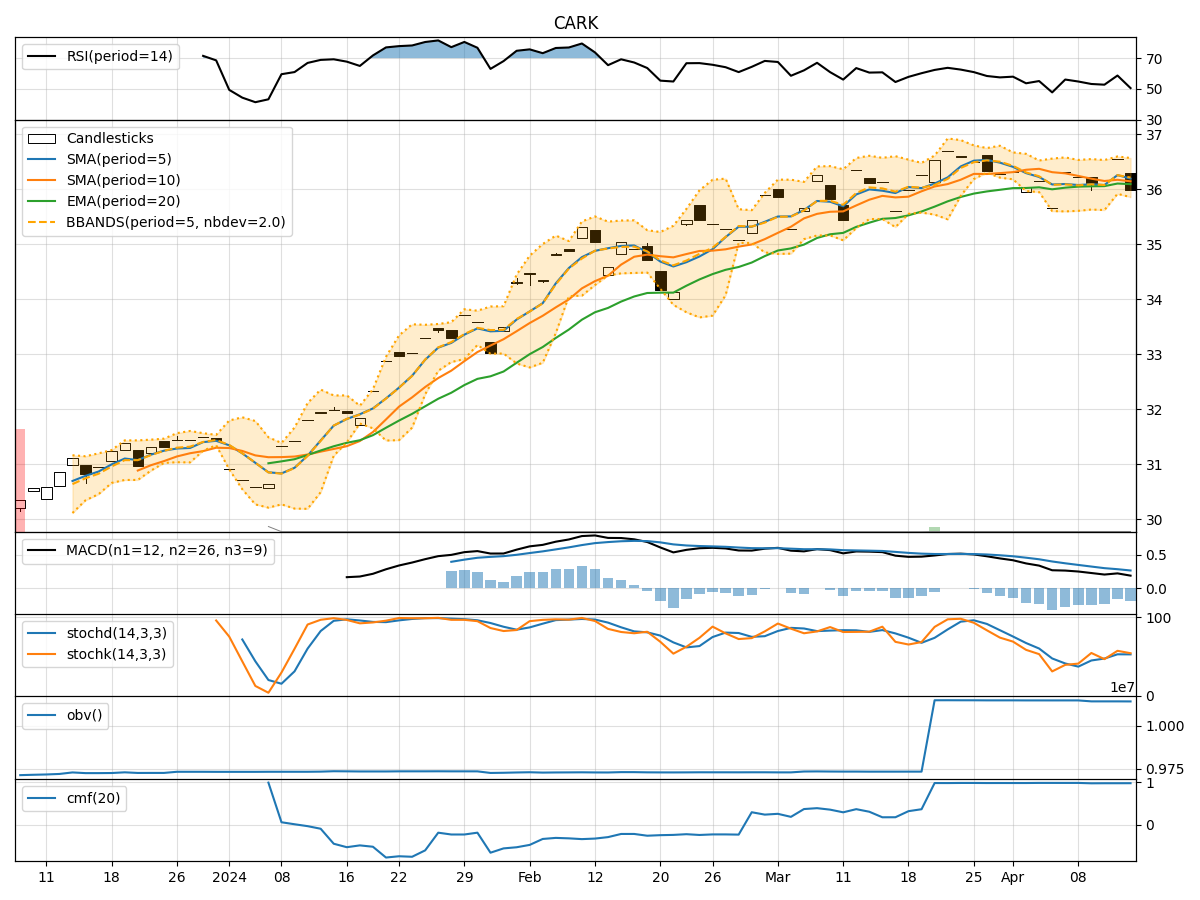
In the last 5 trading days, CARK stock has shown mixed signals across various technical indicators. The trend indicators suggest a slightly bullish sentiment, with the moving averages trending upwards. Momentum indicators indicate a neutral to slightly bullish momentum, while volatility indicators show a decreasing volatility trend. Volume indicators also reflect a mixed sentiment, with some divergence in the OBV and CMF values.
Trend Indicators:
- Moving Averages (MA): The 5-day MA is above the 10-day SMA, indicating a short-term bullish trend. The EMA(20) is also trending upwards, supporting a bullish view.
- MACD: The MACD line is above the signal line, suggesting a bullish momentum.
- MACD Histogram: The MACD histogram is positive, indicating increasing bullish momentum.
Key Observation: The trend indicators overall suggest a bullish sentiment in the short term.
Momentum Indicators:
- RSI: The RSI is in the neutral zone, indicating neither overbought nor oversold conditions.
- Stochastic Oscillator: Both %K and %D are in the overbought zone, suggesting a potential reversal.
- Williams %R: The Williams %R is close to the oversold territory, indicating a possible buying opportunity.
Key Observation: Momentum indicators show a mixed sentiment, with some indicators hinting at a potential reversal.
Volatility Indicators:
- Bollinger Bands: The bands are narrowing, indicating decreasing volatility.
- Bollinger %B: The %B is close to 1, suggesting a potential overbought condition.
Key Observation: Volatility indicators point towards decreasing volatility and a possible consolidation phase.
Volume Indicators:
- On-Balance Volume (OBV): The OBV has shown a slight increase, indicating some buying pressure.
- Chaikin Money Flow (CMF): The CMF is slightly positive, suggesting a mild inflow of money into the stock.
Key Observation: Volume indicators are mixed, with OBV showing buying pressure but CMF indicating a neutral sentiment.
Conclusion:
Based on the analysis of the technical indicators, the next few days for CARK stock could see sideways movement with a slight bullish bias. The trend indicators support a bullish view, while momentum indicators suggest a potential reversal or consolidation. Volatility indicators point towards decreasing volatility, which could lead to a period of sideways movement. Volume indicators are inconclusive but lean slightly towards a bullish sentiment.
Overall, the stock is likely to experience consolidation in the near term with a potential for a bullish breakout. Traders should watch for key support and resistance levels to confirm the direction of the next price movement.