Technical Analysis of CARU 2024-05-10
Overview:
In analyzing the technical indicators for CARU stock over the last 5 days, we will delve into the trend, momentum, volatility, and volume indicators to provide a comprehensive outlook on the possible stock price movement in the coming days. By examining these key indicators, we aim to offer valuable insights and predictions for informed decision-making.
Trend Analysis:
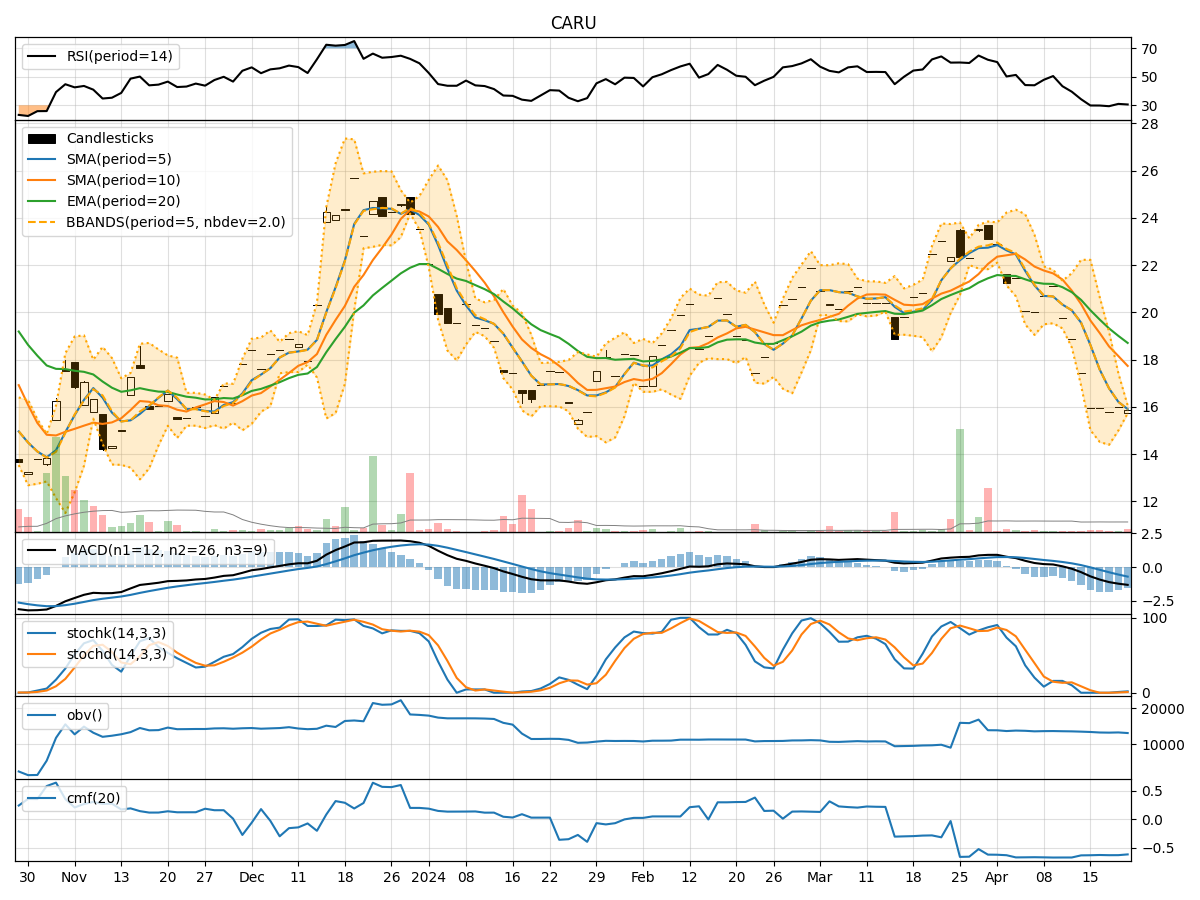
- Moving Averages (MA): The 5-day Moving Average (MA) has been consistently above the Simple Moving Average (SMA) and Exponential Moving Average (EMA), indicating a bullish trend.
- MACD: The MACD line has been above the signal line, suggesting a positive momentum in the stock price.
- MACD Histogram: The MACD Histogram has been consistently above the zero line, further supporting the bullish trend.
Momentum Analysis:
- RSI: The Relative Strength Index (RSI) has been fluctuating around the 50 level, indicating a neutral momentum in the stock.
- Stochastic Oscillator: Both %K and %D lines of the Stochastic Oscillator have been declining, signaling a potential reversal in momentum.
- Williams %R: The Williams %R indicator has been in oversold territory, suggesting a possible bullish reversal.
Volatility Analysis:
- Bollinger Bands (BB): The stock price has been trading within the Bollinger Bands, with the bands narrowing, indicating decreasing volatility.
- Bollinger %B: The %B indicator has been hovering around the midline, reflecting a neutral stance in terms of volatility.
Volume Analysis:
- On-Balance Volume (OBV): The OBV indicator has been relatively stable, showing consistent buying interest in the stock.
- Chaikin Money Flow (CMF): The CMF indicator has been positive, indicating strong buying pressure in the stock.
Conclusion:
Based on the analysis of the technical indicators, the stock of CARU is likely to experience sideways consolidation in the coming days. The bullish trend indicated by the moving averages and MACD suggests a potential upward movement, while the neutral momentum and volatility indicators point towards a period of consolidation. The positive OBV and CMF readings support the notion of a stable stock price with underlying buying interest.
Recommendation:
Considering the overall technical outlook, it is advisable to monitor the stock closely for any signs of a breakout from the consolidation phase. Traders may consider buying on dips within the consolidation range and setting appropriate stop-loss levels to manage risk. Long-term investors can use this consolidation phase as an opportunity to accumulate the stock at favorable levels. As always, it is essential to stay updated on market developments and adjust strategies accordingly.