Technical Analysis of CARY 2024-05-10
Overview:
In analyzing the technical indicators for CARY stock over the last 5 days, we will delve into the trend, momentum, volatility, and volume indicators to provide a comprehensive outlook on the possible stock price movement in the coming days. By examining these key indicators, we aim to offer valuable insights and predictions for potential investors.
Trend Analysis:
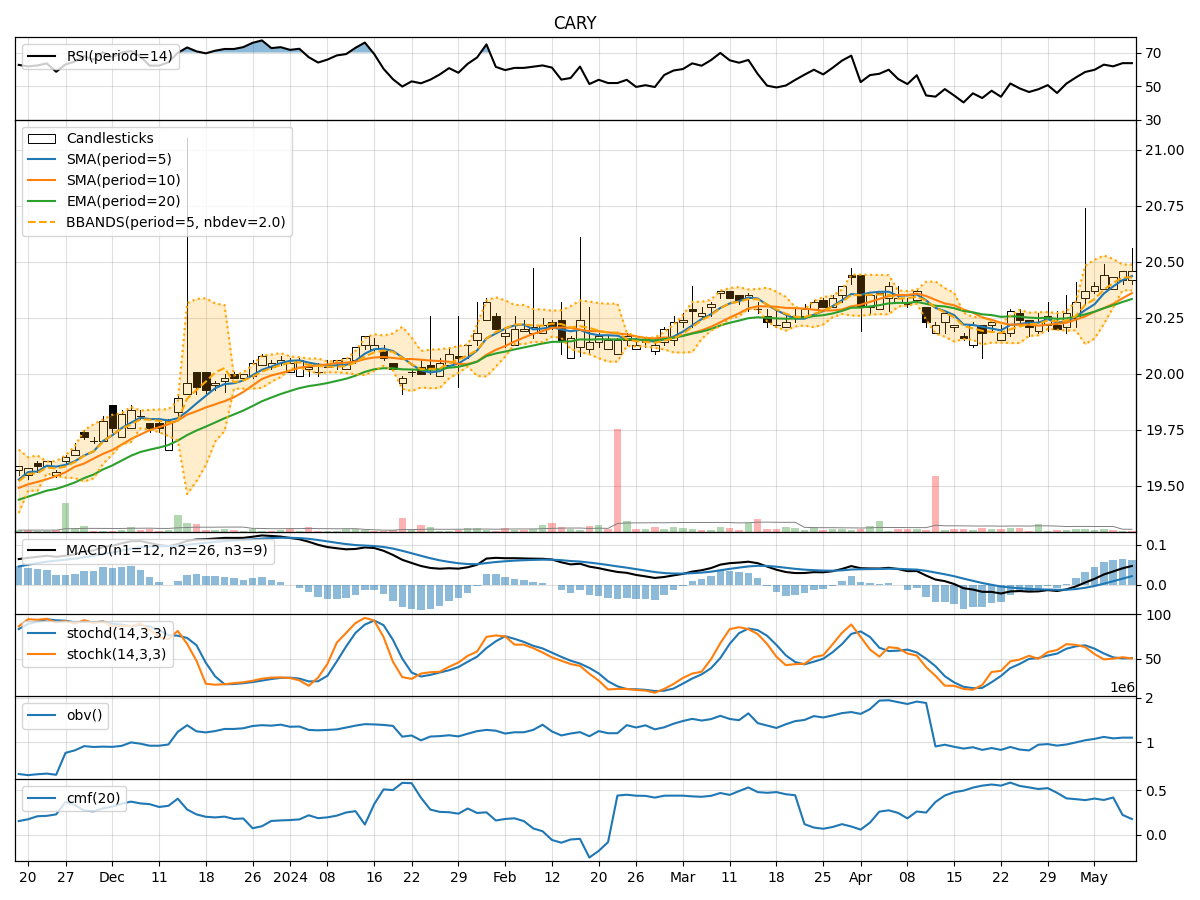
- Moving Averages (MA): The 5-day Moving Average (MA) has been consistently above the Simple Moving Average (SMA) and Exponential Moving Average (EMA), indicating a bullish trend.
- MACD: The MACD line has been consistently above the signal line, with both lines showing an upward trend, suggesting bullish momentum.
Momentum Analysis:
- RSI: The Relative Strength Index (RSI) has been hovering around 60-64, indicating a neutral to slightly bullish momentum.
- Stochastic Oscillator: Both %K and %D lines of the Stochastic Oscillator have been fluctuating around the mid-level, suggesting a lack of strong momentum in either direction.
Volatility Analysis:
- Bollinger Bands (BB): The stock price has been trading within the Bollinger Bands, with the bands narrowing, indicating decreasing volatility.
Volume Analysis:
- On-Balance Volume (OBV): The OBV has shown a slight decrease over the last few days, indicating some selling pressure.
- Chaikin Money Flow (CMF): The CMF has been positive but decreasing, suggesting a weakening buying pressure.
Key Observations:
- The trend indicators suggest a bullish sentiment in the short term.
- Momentum indicators show a lack of strong momentum in either direction.
- Volatility has been decreasing, indicating a possible period of consolidation.
- Volume indicators point towards a slight decrease in buying pressure.
Conclusion:
Based on the analysis of the technical indicators, the stock is likely to experience sideways movement or consolidation in the coming days. While the trend indicators are bullish, the lack of strong momentum and decreasing volatility suggest a period of stabilization. Investors may expect the stock price to trade within a narrow range with no significant upward or downward movement in the near term. It is advisable to closely monitor the price action and key support/resistance levels for potential trading opportunities.