Technical Analysis of CARZ 2024-05-10
Overview:
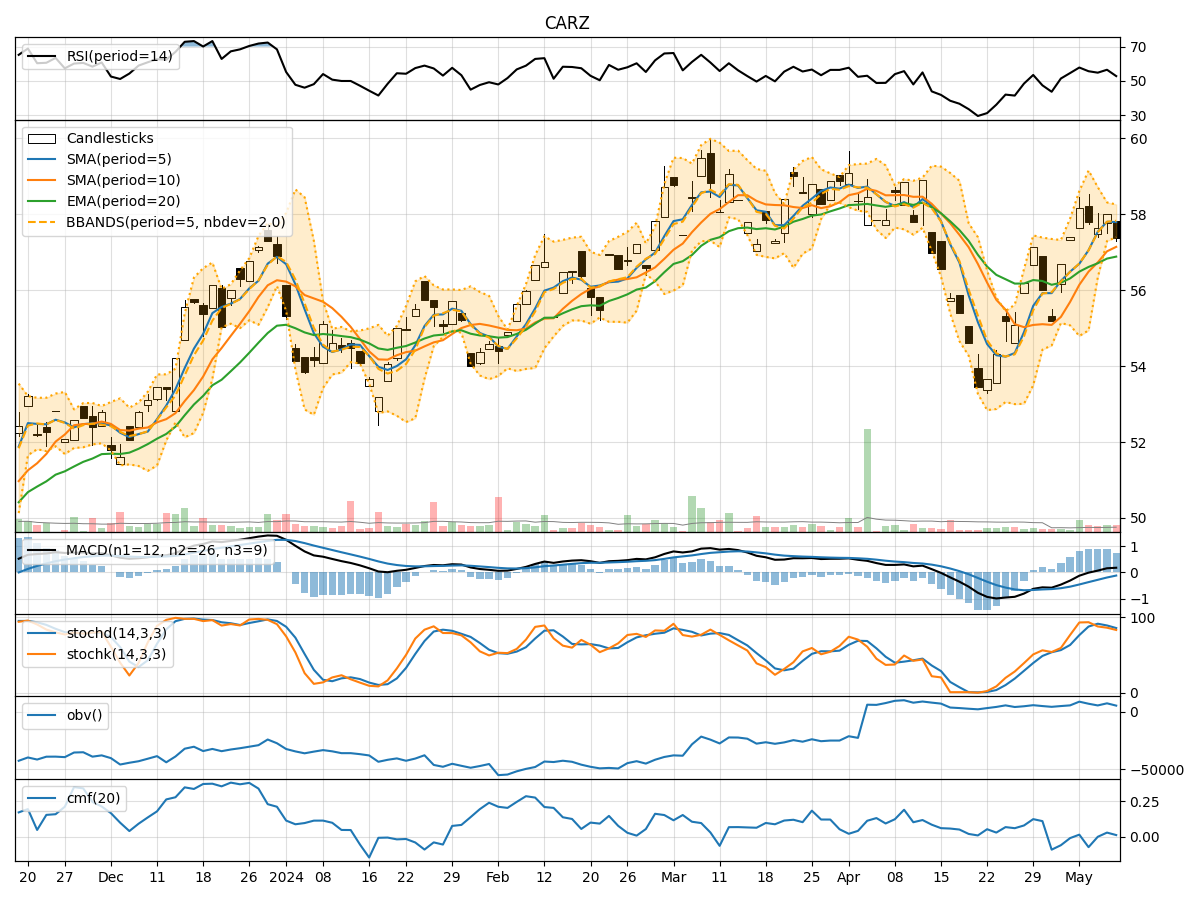
In analyzing the technical indicators for CARZ over the last 5 days, we will delve into the trend, momentum, volatility, and volume indicators to provide a comprehensive outlook on the possible stock price movement in the coming days.
Trend Indicators:
- Moving Averages (MA): The 5-day Moving Average (MA) has been consistently above the Simple Moving Average (SMA) and Exponential Moving Average (EMA), indicating a bullish trend.
- MACD: The MACD line has been consistently above the signal line, suggesting a bullish momentum.
- MACD Histogram: The MACD Histogram has been mostly positive, indicating increasing bullish momentum.
Momentum Indicators:
- RSI: The Relative Strength Index (RSI) has been fluctuating but generally staying within the overbought territory, indicating strong buying pressure.
- Stochastic Oscillator: Both %K and %D have been relatively high, suggesting an overbought condition.
- Williams %R: The Williams %R has been consistently in the oversold region, indicating a potential reversal.
Volatility Indicators:
- Bollinger Bands: The stock price has mostly stayed within the Bollinger Bands, with the bands narrowing, indicating decreasing volatility.
- Bollinger %B: The %B indicator has been fluctuating around the midline, suggesting a lack of clear trend direction.
Volume Indicators:
- On-Balance Volume (OBV): The OBV has shown mixed signals, with some days seeing positive volume accumulation and others showing distribution.
- Chaikin Money Flow (CMF): The CMF has been mostly positive, indicating buying pressure in the market.
Key Observations and Opinions:
- Trend: The trend indicators suggest a bullish sentiment in the short term.
- Momentum: Momentum indicators indicate a mix of overbought and oversold conditions, potentially signaling a consolidation phase.
- Volatility: Volatility has been decreasing, which could lead to a period of consolidation or a potential breakout.
- Volume: Volume indicators show mixed signals, reflecting uncertainty in market participation.
Conclusion:
Based on the analysis of the technical indicators, the next few days for CARZ could see sideways movement or consolidation as the stock price may stabilize after a period of bullish momentum. Traders should closely monitor key support and resistance levels for potential breakout opportunities. It is advisable to wait for clearer signals from the indicators before making significant trading decisions.