Technical Analysis of CBON 2024-05-10
Overview:
In analyzing the technical indicators for CBON stock over the last 5 days, we will delve into the trend, momentum, volatility, and volume indicators to provide a comprehensive outlook on the possible stock price movement in the coming days. By examining these key aspects, we aim to offer valuable insights and predictions to guide investment decisions.
Trend Analysis:
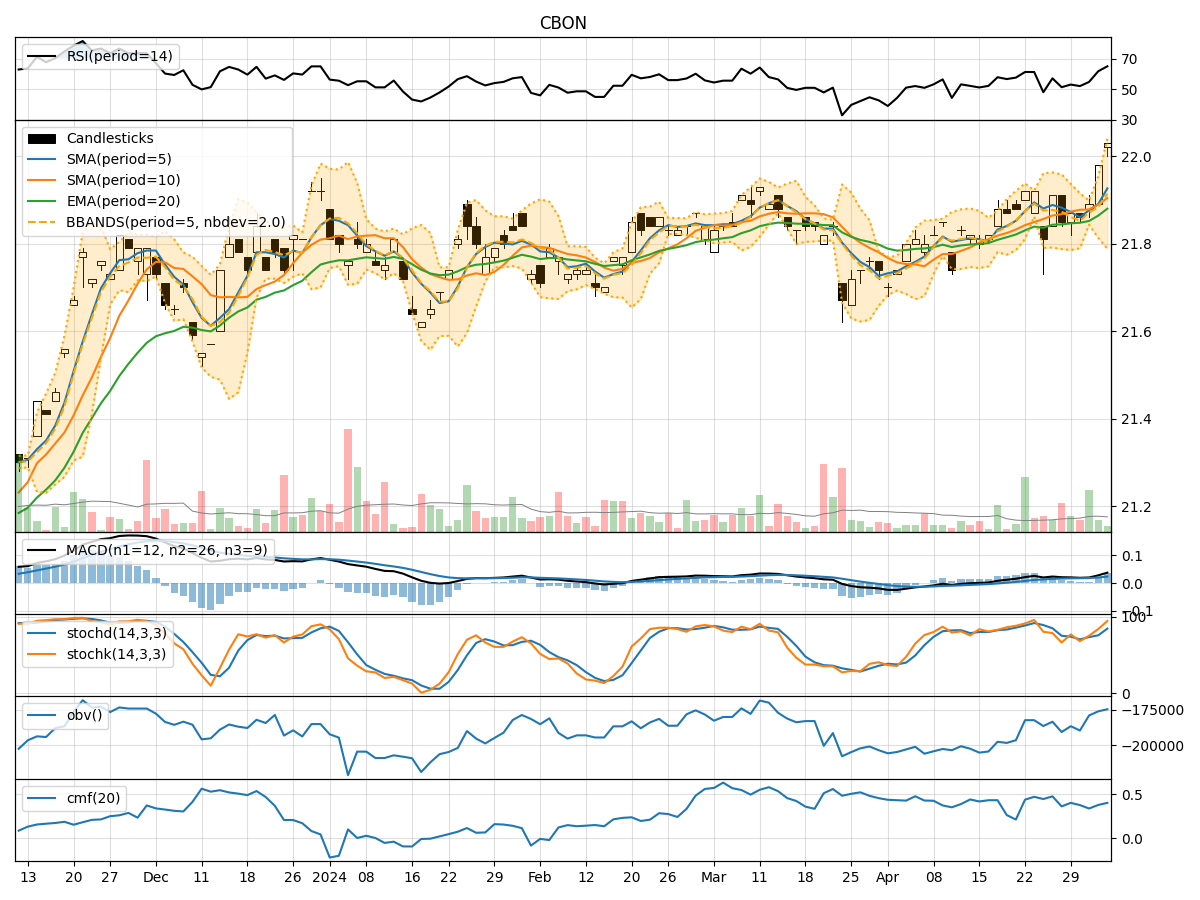
- Moving Averages (MA): The 5-day MA has been relatively stable around the current price, indicating a neutral trend.
- MACD: The MACD line has been decreasing slightly, but the MACD histogram remains positive, suggesting a potential slowdown in momentum.
Key Observation: The trend indicators suggest a neutral to slightly bearish sentiment in the short term.
Momentum Analysis:
- RSI: The RSI has been fluctuating around the 50 level, indicating a lack of strong momentum in either direction.
- Stochastic Oscillator: Both %K and %D have been hovering around the mid-range, reflecting a lack of clear direction.
Key Observation: Momentum indicators signal a lack of strong momentum, implying a potential consolidation phase.
Volatility Analysis:
- Bollinger Bands (BB): The bands have been narrowing, indicating decreasing volatility in the stock price.
Key Observation: Volatility has been decreasing, suggesting a potential period of consolidation or a breakout in the near future.
Volume Analysis:
- On-Balance Volume (OBV): The OBV has shown mixed movements, reflecting indecision among market participants.
- Chaikin Money Flow (CMF): The CMF has been relatively stable, indicating a balanced flow of money into and out of the stock.
Key Observation: Volume indicators suggest a lack of strong buying or selling pressure, pointing towards a potential sideways movement.
Conclusion:
Based on the analysis of the technical indicators, the stock price of CBON is likely to experience sideways movement in the coming days. The lack of strong trends in both momentum and volume, coupled with decreasing volatility, indicates a period of consolidation or range-bound trading. Traders may expect the stock to trade within a narrow range without a clear directional bias.
Key Conclusion: The overall outlook for CBON stock is neutral to slightly bearish in the short term, with a higher probability of sideways movement. Investors should exercise caution and wait for clearer signals before making significant trading decisions.
By carefully monitoring the evolving market dynamics and staying attuned to any shifts in the technical indicators, investors can adapt their strategies accordingly to capitalize on potential opportunities or mitigate risks effectively.