Technical Analysis of CBSE 2024-05-10
Overview:
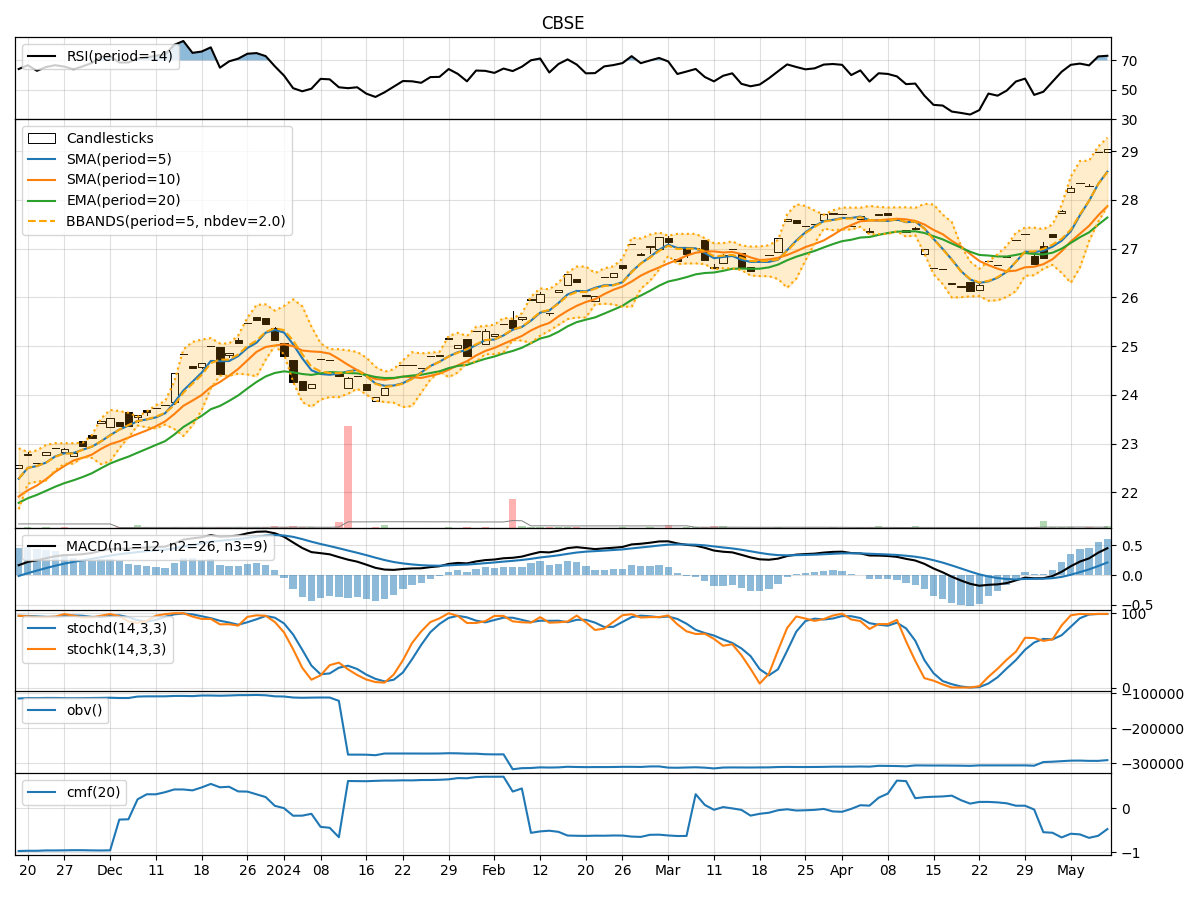
In the last 5 trading days, the stock price of CBSE has shown a consistent upward trend, supported by positive momentum and volatility indicators. The volume has also been relatively stable. We will analyze the technical indicators in the trend, momentum, volatility, and volume categories to provide insights into the possible future stock price movement of CBSE.
Trend Indicators:
- Moving Averages (MA): The 5-day MA has been consistently above the 10-day SMA, indicating a short-term bullish trend.
- Exponential Moving Average (EMA): The EMA has been steadily increasing, reflecting a positive trend in the stock price.
- Moving Average Convergence Divergence (MACD): The MACD line has been above the signal line, suggesting a bullish momentum.
Key Observation: The trend indicators suggest a strong bullish sentiment in the stock price of CBSE.
Momentum Indicators:
- Relative Strength Index (RSI): RSI values have been above 70, indicating an overbought condition but also strong bullish momentum.
- Stochastic Oscillator: Both %K and %D values have been consistently high, signaling strong buying pressure.
- Williams %R (Willams %R): The indicator has been consistently below -20, indicating an overbought condition.
Key Observation: Momentum indicators confirm the strong bullish momentum in CBSE's stock price.
Volatility Indicators:
- Bollinger Bands (BB): The stock price has been trading near the upper Bollinger Band, suggesting high volatility and potential overbought conditions.
- Bollinger Band %B (BB %B): The %B value has been above 0.8, indicating a potential overbought condition.
Key Observation: Volatility indicators point towards high volatility and a possible overbought scenario in CBSE's stock.
Volume Indicators:
- On-Balance Volume (OBV): The OBV has shown a slight increase, indicating a positive accumulation of volume.
- Chaikin Money Flow (CMF): The CMF has been negative, suggesting some selling pressure in the stock.
Key Observation: Volume indicators show a mixed signal with a slight positive bias in volume accumulation.
Conclusion:
Based on the analysis of the technical indicators, the next few days' possible stock price movement for CBSE is likely to continue in an upward direction. The strong bullish trend and momentum indicators, coupled with high volatility, suggest that the stock price may experience further gains. However, investors should be cautious of the overbought conditions indicated by some indicators and monitor the volume closely for any signs of divergence.
Overall View: Bullish with a note of caution on potential overbought conditions.