Technical Analysis of CCOR 2024-05-10
Overview:
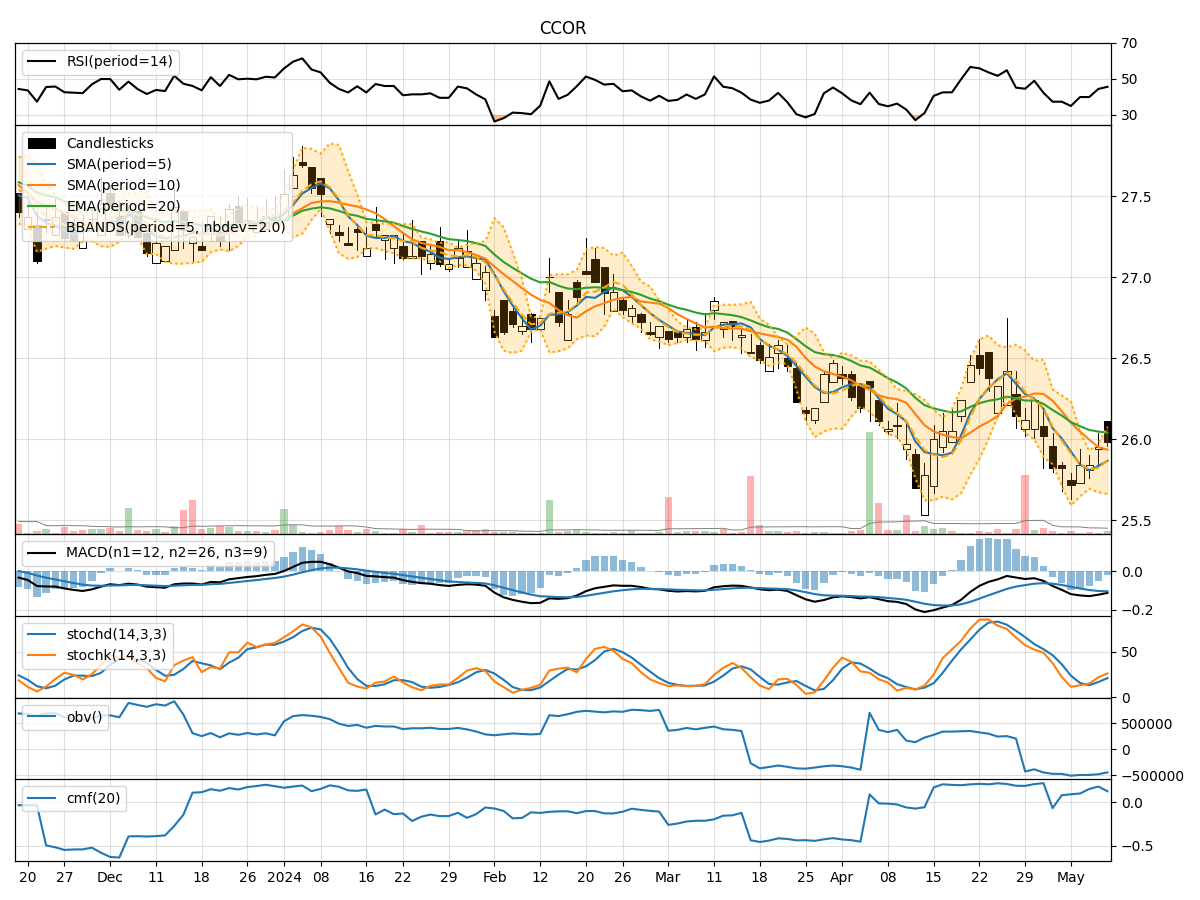
In the last 5 trading days, CCOR stock has shown mixed signals across various technical indicators. The trend indicators suggest a slightly bearish sentiment with the stock price hovering around the moving averages. Momentum indicators show a neutral to slightly bullish momentum, while volatility indicators indicate a narrowing of the Bollinger Bands. Volume indicators show a decrease in On-Balance Volume (OBV) but a positive Chaikin Money Flow (CMF) over the past 20 days.
Trend Indicators:
- Moving Averages (MA): The stock price is below the 5-day MA, indicating a short-term bearish trend.
- MACD: The MACD line is below the signal line, suggesting a bearish momentum.
- MACD Histogram: The histogram is negative, indicating a bearish trend.
Momentum Indicators:
- RSI: The RSI is below 50, indicating a neutral sentiment.
- Stochastic Oscillator: Both %K and %D are below 50, suggesting a neutral to slightly bullish momentum.
- Williams %R: The indicator is in oversold territory, indicating a potential buying opportunity.
Volatility Indicators:
- Bollinger Bands: The bands are narrowing, suggesting a decrease in volatility and a possible consolidation phase.
- Bollinger %B: The %B is below 1, indicating the stock is trading below the lower band.
Volume Indicators:
- On-Balance Volume (OBV): The OBV has been decreasing, indicating a potential distribution phase.
- Chaikin Money Flow (CMF): The CMF is positive, suggesting buying pressure over the past 20 days.
Key Observations:
- The stock is currently in a consolidation phase with a slightly bearish bias based on trend indicators.
- Momentum indicators show a neutral to slightly bullish sentiment, indicating potential for a minor upside movement.
- Volatility has decreased, suggesting a period of consolidation and potential price stability.
- Volume indicators show a decrease in OBV but a positive CMF, indicating mixed sentiment among investors.
Conclusion:
Based on the analysis of technical indicators, the next few days for CCOR stock are likely to see sideways movement with a slight bearish bias. Traders may observe a lack of clear trend direction, with the stock potentially trading within a narrow range. Investors should exercise caution and wait for clearer signals before making significant trading decisions.