Technical Analysis of CDC 2024-05-10
Overview:
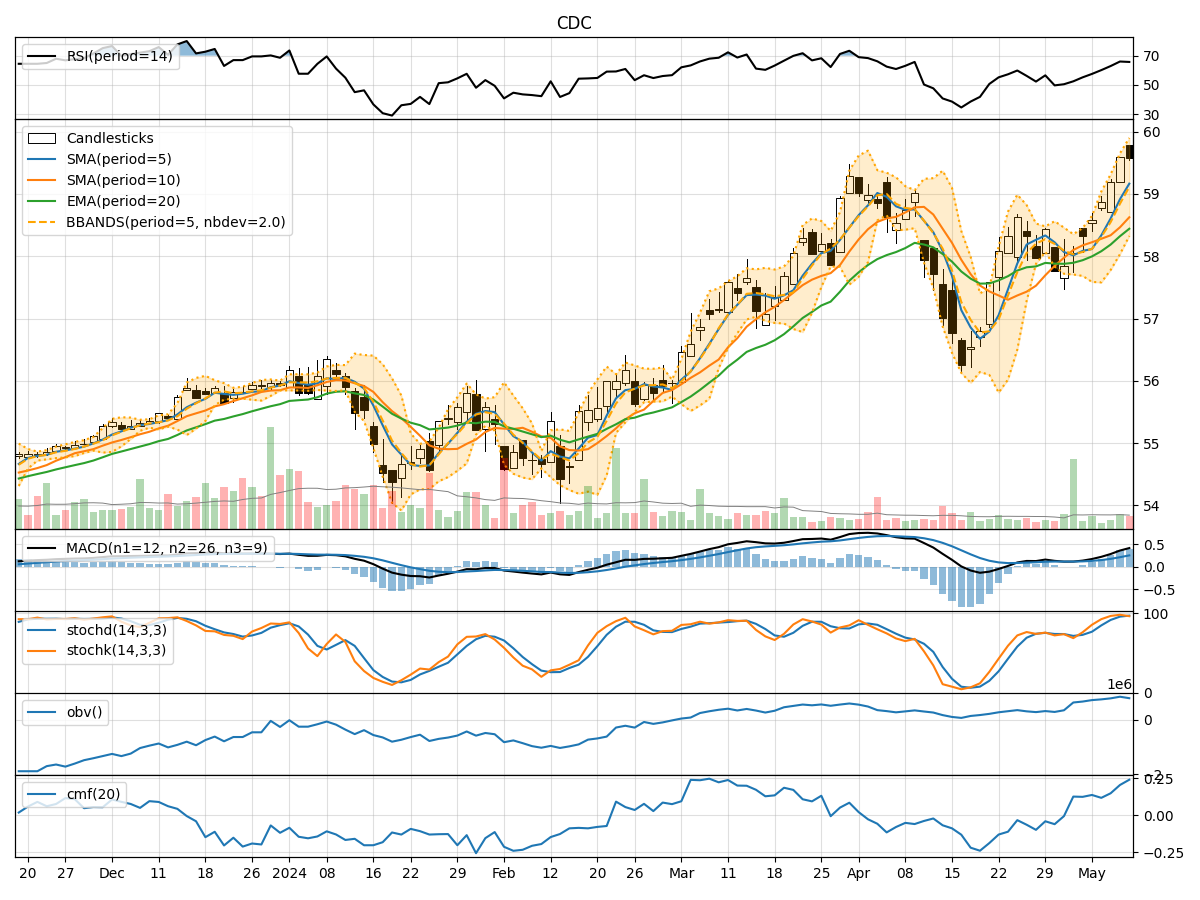
In the last 5 trading days, CDC stock has shown a consistent uptrend in both price and volume. The moving averages have been trending upwards, indicating a bullish sentiment. Momentum indicators like RSI and Stochastic oscillators suggest the stock is in overbought territory but still showing strength. Volatility indicators show expanding Bollinger Bands, indicating increased price movement. Volume indicators confirm the uptrend with rising On-Balance Volume (OBV) and Chaikin Money Flow (CMF) values.
Trend Indicators Analysis:
- Moving averages (MA) are trending upwards, indicating a bullish trend.
- MACD is positive and increasing, showing bullish momentum.
- The stock is trading above its short-term moving averages, a positive sign.
- EMA is also trending upwards, supporting the bullish sentiment.
Momentum Indicators Analysis:
- RSI is in overbought territory, suggesting a potential pullback.
- Stochastic oscillators are in the overbought zone, indicating a possible reversal.
- Williams %R is in oversold territory, signaling a potential correction.
Volatility Indicators Analysis:
- Bollinger Bands are widening, indicating increased volatility.
- The upper Bollinger Band is expanding faster than the lower band, suggesting a bullish bias.
- Bollinger Band %B is above 0.5, indicating an uptrend.
Volume Indicators Analysis:
- OBV is rising, confirming the uptrend in price.
- CMF is positive and increasing, indicating strong buying pressure.
- Volume has been relatively consistent and supportive of the price movement.
Key Observations:
- Trend: Upward trend supported by moving averages and MACD.
- Momentum: Overbought conditions may lead to a short-term pullback.
- Volatility: Increasing volatility could lead to larger price swings.
- Volume: Rising volume confirms the uptrend and buying interest.
Conclusion:
Based on the technical analysis of CDC stock: - Trend: Upward - Momentum: Potential short-term pullback - Volatility: Increasing - Volume: Supportive of the uptrend
Forecast:
Considering the overall bullish trend, increasing volatility, and supportive volume, the next few days for CDC stock are likely to see further upward movement. However, caution is advised due to overbought conditions in momentum indicators, which could lead to a short-term pullback before the uptrend resumes. Traders should monitor key support levels and consider taking profits on any significant price spikes.