Technical Analysis of CDEI 2024-05-10
Overview:
In analyzing the technical indicators for CDEI over the last 5 days, we will delve into the trend, momentum, volatility, and volume indicators to provide a comprehensive outlook on the possible stock price movement in the coming days. By examining these key aspects, we aim to offer valuable insights and predictions to guide your investment decisions.
Trend Indicators:
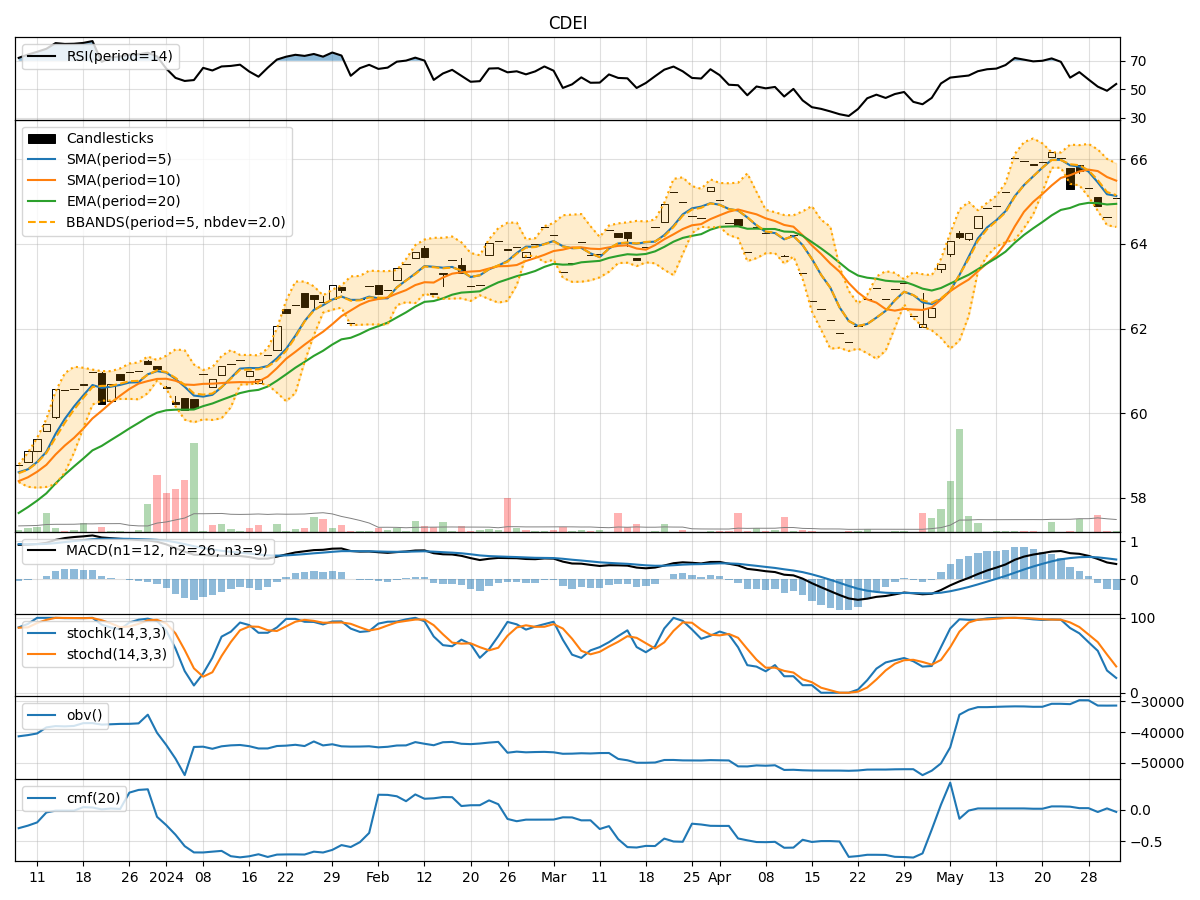
- Moving Averages (MA): The 5-day moving average has been consistently above the simple moving average (SMA) and exponential moving average (EMA), indicating a bullish trend.
- MACD: The MACD line has been above the signal line, with both lines showing an upward trend, suggesting bullish momentum.
- MACD Histogram: The histogram has been increasing over the past 5 days, indicating strengthening bullish momentum.
Momentum Indicators:
- RSI: The Relative Strength Index (RSI) has been gradually increasing and is currently in the overbought territory, signaling a strong bullish momentum.
- Stochastic Oscillator: Both %K and %D lines of the Stochastic Oscillator are in the overbought zone, indicating a strong bullish momentum.
- Williams %R: The Williams %R is also in the oversold region, further supporting the bullish sentiment.
Volatility Indicators:
- Bollinger Bands: The stock price has been trading within the upper Bollinger Band (BBU) range, suggesting high volatility and potential overbought conditions.
- Bollinger Band Width: The Band Width has been narrowing, indicating a potential decrease in volatility and a possible consolidation phase.
Volume Indicators:
- On-Balance Volume (OBV): The OBV has shown a positive trend over the last 5 days, indicating accumulation by investors.
- Chaikin Money Flow (CMF): The CMF has been positive, reflecting buying pressure in the stock.
Key Observations and Opinions:
- Trend: The trend indicators suggest a strong bullish sentiment in the stock.
- Momentum: Momentum indicators confirm the bullish trend with overbought conditions.
- Volatility: High volatility and potential overbought conditions are indicated by the Bollinger Bands.
- Volume: Positive OBV and CMF indicate buying pressure and accumulation.
Conclusion:
Based on the analysis of the technical indicators, the stock of CDEI is strongly bullish in the short term. The trend, momentum, and volume indicators all point towards further upside potential. However, given the high volatility and overbought conditions, a brief consolidation or pullback may occur before the uptrend resumes. Investors should consider entering long positions on any dips or consolidation phases to capitalize on the bullish momentum. It is essential to monitor the price action closely and set appropriate stop-loss levels to manage risk effectively.