Technical Analysis of CDL 2024-05-10
Overview:
In analyzing the technical indicators for the last 5 days of CDL stock, we will delve into the trend, momentum, volatility, and volume indicators to provide a comprehensive outlook on the possible stock price movement in the coming days. By examining these key indicators, we aim to offer valuable insights and recommendations for potential investors.
Trend Analysis:
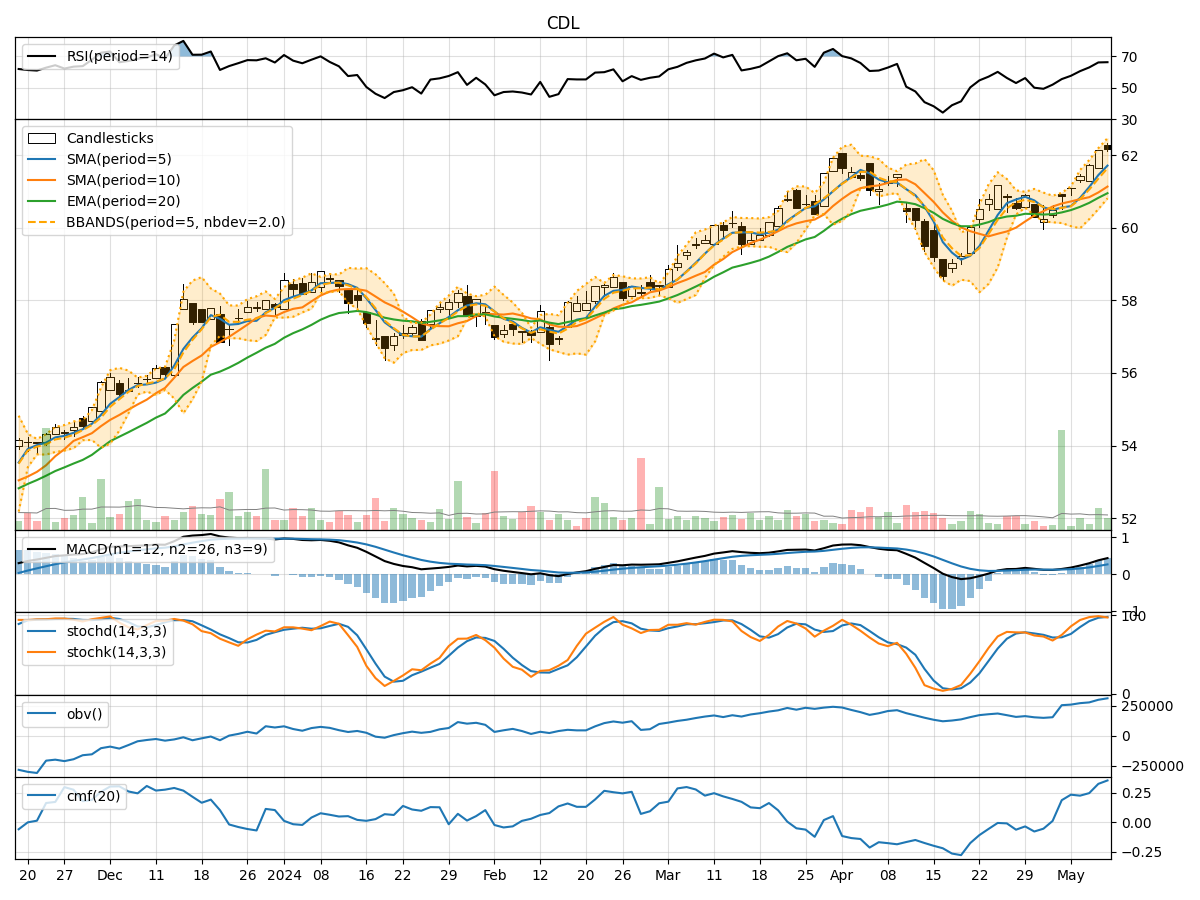
- Moving Averages (MA): The 5-day MA has been consistently above the closing prices, indicating an upward trend.
- MACD: The MACD line has been above the signal line, suggesting a bullish momentum.
- RSI: The RSI values have been increasing, reflecting strengthening buying pressure.
Momentum Analysis:
- Stochastic Oscillator: Both %K and %D values have been in the overbought zone, signaling a potential reversal.
- Williams %R: The indicator has been in the oversold territory, indicating a possible buying opportunity.
Volatility Analysis:
- Bollinger Bands (BB): The stock price has been trading within the bands, showing stability in price movement.
- BB Width: The bands have been narrowing, suggesting a potential breakout or consolidation.
Volume Analysis:
- On-Balance Volume (OBV): The OBV has been steadily increasing, indicating accumulation by investors.
- Chaikin Money Flow (CMF): The CMF has been positive, reflecting buying pressure in the stock.
Key Observations:
- The trend indicators suggest a bullish sentiment with moving averages and MACD supporting an upward trajectory.
- Momentum indicators show mixed signals with stochastic oscillator hinting at a possible reversal.
- Volatility indicators point towards a potential breakout or consolidation phase.
- Volume indicators indicate increasing buying interest and positive money flow into the stock.
Conclusion:
Based on the analysis of technical indicators, the next few days' possible stock price movement for CDL is likely to be bullish. The trend is supported by moving averages and MACD, while momentum indicators show some caution with overbought signals. Volatility suggests a potential breakout, and volume indicators indicate strong buying pressure. Therefore, investors may consider buying CDL stock in the coming days with a focus on managing risks associated with overbought conditions in momentum indicators.