Technical Analysis of CEFA 2024-05-10
Overview:
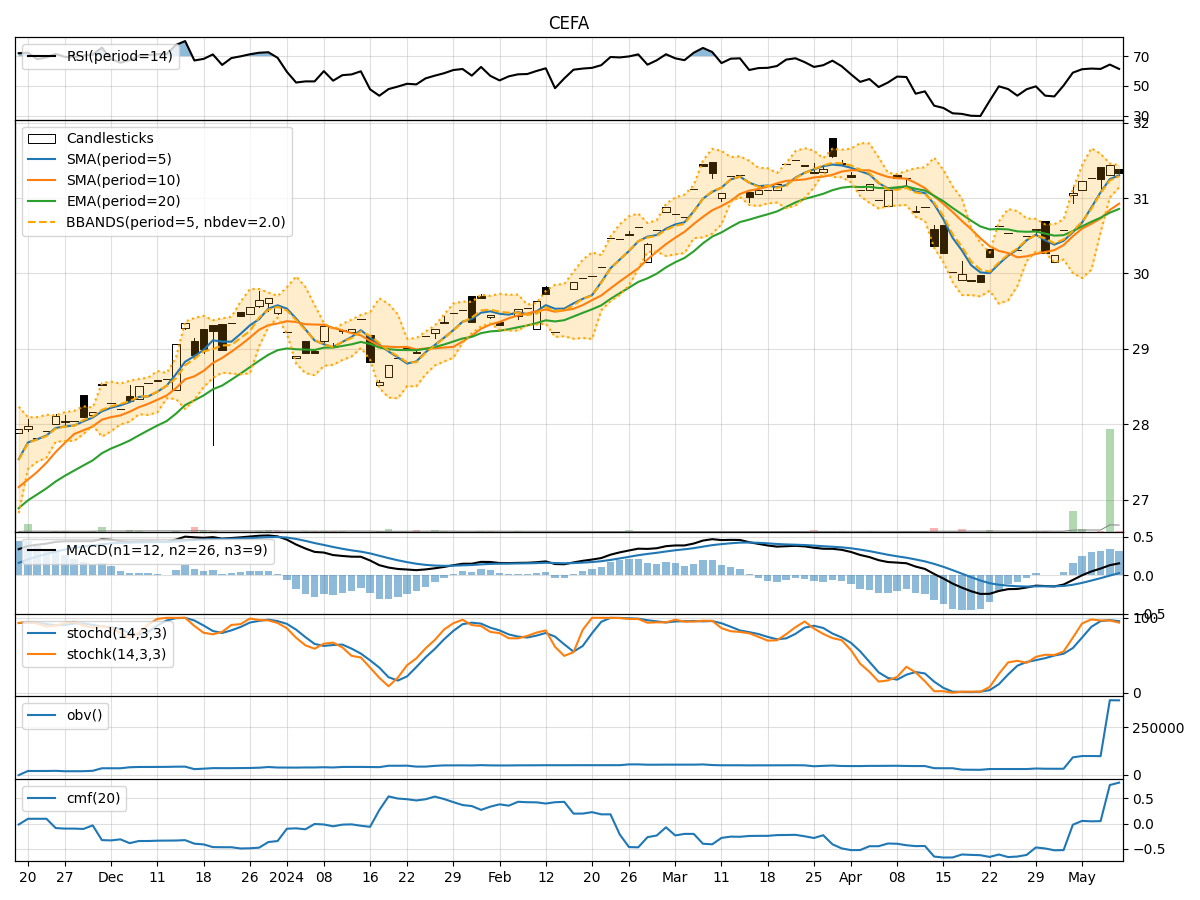
In the last 5 trading days, the stock has shown a consistent uptrend in terms of closing prices. The moving averages (MA) have been trending upwards, indicating a positive momentum. The Relative Strength Index (RSI) and Stochastic indicators suggest the stock is in overbought territory, while the Bollinger Bands show increasing volatility. The On-Balance Volume (OBV) and Chaikin Money Flow (CMF) indicators reflect strong buying pressure.
Trend Indicators:
- Moving Averages (MA): The 5-day MA has been consistently above the 10-day Simple Moving Average (SMA), indicating a short-term bullish trend. The Exponential Moving Average (EMA) has also been trending upwards, supporting the bullish sentiment.
- MACD: The MACD line has been above the signal line for the past few days, indicating a bullish trend. The MACD Histogram has been increasing, suggesting strengthening bullish momentum.
Momentum Indicators:
- RSI: The RSI has been in the overbought zone for the last few days, indicating a potential reversal or consolidation in the near future.
- Stochastic Oscillator: Both %K and %D lines of the Stochastic oscillator have been in the overbought region, signaling a potential reversal or pullback.
Volatility Indicators:
- Bollinger Bands (BB): The Bollinger Bands have been widening, indicating increasing volatility in the stock price. The current price is close to the upper band, suggesting a potential overbought condition.
Volume Indicators:
- On-Balance Volume (OBV): The OBV has been steadily increasing, indicating strong buying pressure and accumulation of the stock.
- Chaikin Money Flow (CMF): The CMF has been positive for the last 5 days, indicating strong buying pressure and bullish sentiment.
Key Observations:
- The stock is currently in an overbought condition based on the RSI and Stochastic indicators.
- The MACD and moving averages suggest a bullish trend in the short term.
- Increasing volatility as per the Bollinger Bands may lead to a potential price correction or consolidation.
- Strong buying pressure indicated by OBV and CMF supports the bullish outlook.
Conclusion:
Based on the technical indicators and analysis: - Short-Term View: The stock is likely to experience a pullback or consolidation in the near term due to overbought conditions indicated by the RSI and Stochastic oscillators. - Medium- to Long-Term View: The overall trend remains bullish, supported by the moving averages, MACD, OBV, and CMF indicators. However, caution is advised due to the potential for increased volatility as shown by the Bollinger Bands.
Recommendation:
- Short-Term Traders: Consider taking profits or implementing risk management strategies to navigate the expected pullback or consolidation phase.
- Long-Term Investors: Hold onto positions with a watchful eye on the evolving price action and key support levels.
Always remember to monitor the stock closely, as market conditions can change rapidly. Conduct further analysis and consider other factors before making any trading or investment decisions.