Technical Analysis of CEFD 2024-05-10
Overview:
In analyzing the technical indicators for CEFD over the last 5 days, we will delve into the trend, momentum, volatility, and volume indicators to provide a comprehensive outlook on the possible stock price movement in the coming days. By examining these key indicators, we aim to offer valuable insights and predictions for potential investors.
Trend Indicators:
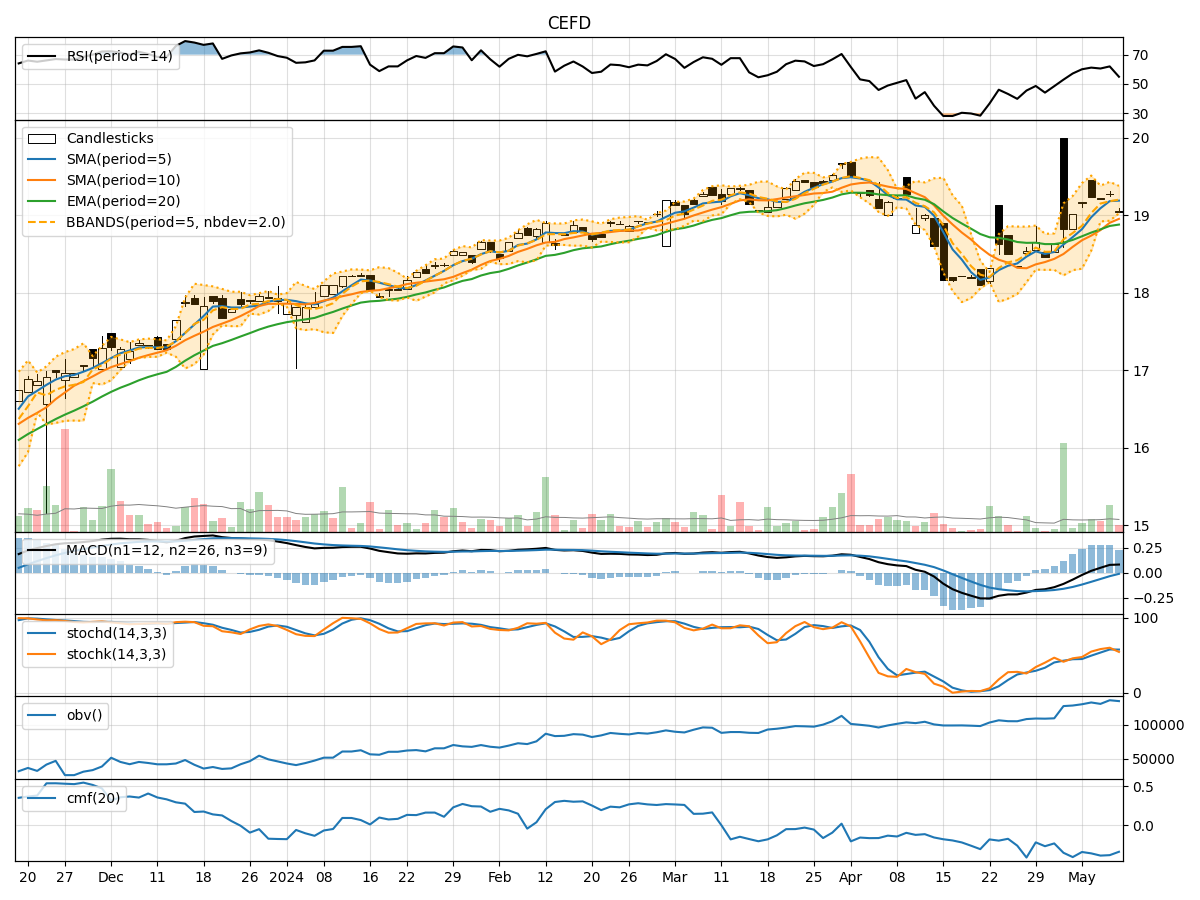
- Moving Averages (MA): The 5-day Moving Average (MA) has been consistently above the Simple Moving Average (SMA) and Exponential Moving Average (EMA), indicating a bullish trend.
- MACD: The MACD line has been consistently above the signal line, with both lines showing an upward trend, suggesting bullish momentum.
- MACD Histogram: The MACD Histogram has been positive and increasing, further supporting the bullish sentiment.
Momentum Indicators:
- RSI: The Relative Strength Index (RSI) has been hovering around 60, indicating a neutral to slightly bullish momentum.
- Stochastic Oscillator: Both %K and %D lines of the Stochastic Oscillator have been in the overbought zone, suggesting a potential reversal or consolidation.
- Williams %R: The Williams %R is in the oversold territory, indicating a possible buying opportunity.
Volatility Indicators:
- Bollinger Bands: The stock price has been trading within the Bollinger Bands, with the bands narrowing, suggesting a period of consolidation.
- Bollinger %B: The %B indicator is below 1, indicating that the stock price is trading below the upper Bollinger Band, potentially signaling a pullback.
Volume Indicators:
- On-Balance Volume (OBV): The OBV has been fluctuating but has not shown a clear trend, indicating mixed sentiment among investors.
- Chaikin Money Flow (CMF): The CMF has been negative, suggesting that money is flowing out of the stock.
Key Observations:
- The trend indicators suggest a strong bullish sentiment in the short term.
- Momentum indicators show a mixed picture, with potential signs of overbought conditions.
- Volatility indicators point towards a period of consolidation.
- Volume indicators reflect uncertainty and lack of strong buying or selling pressure.
Conclusion:
Based on the analysis of the technical indicators, the stock price of CEFD is likely to experience sideways movement or consolidation in the next few days. While the trend indicators are bullish, the momentum indicators signal potential overbought conditions, and the volatility indicators indicate a period of consolidation. The volume indicators also suggest mixed sentiment among investors. Therefore, it is recommended to exercise caution and closely monitor the price action for any potential reversals or breakout opportunities.