Technical Analysis of CETF 2024-05-10
Overview:
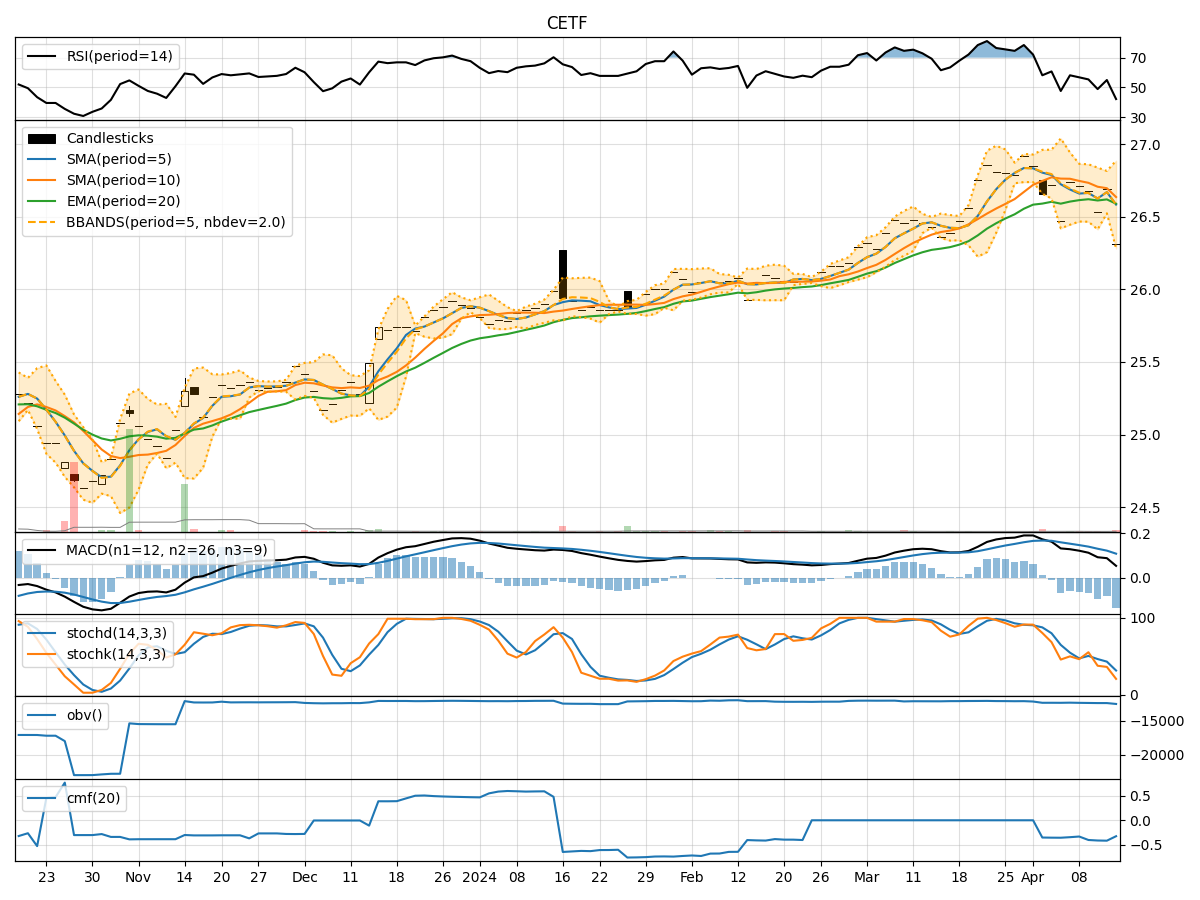
In the last 5 trading days, the CETF stock has shown a relatively stable price movement with slight fluctuations. The trend indicators suggest a positive trend with increasing moving averages and MACD values. Momentum indicators indicate a strong positive momentum, while volatility indicators show a narrowing Bollinger Bands range. Volume indicators reflect a slightly negative trend in OBV and CMF values.
Trend Indicators Analysis:
- Moving Averages (MA): The 5-day MA has been consistently above the 10-day SMA, indicating a short-term bullish trend.
- MACD: The MACD line has been consistently above the signal line, showing a positive momentum trend.
Key Observation: The trend indicators suggest an upward trend in the stock price.
Momentum Indicators Analysis:
- RSI: The RSI values have been above 50, indicating positive momentum.
- Stochastic Oscillator: Both %K and %D values have been consistently high, suggesting strong buying pressure.
Key Observation: Momentum indicators reflect a bullish sentiment in the stock.
Volatility Indicators Analysis:
- Bollinger Bands (BB): The Bollinger Bands have been narrowing, indicating decreasing volatility.
Key Observation: Volatility indicators suggest a consolidation phase in the stock price.
Volume Indicators Analysis:
- On-Balance Volume (OBV): The OBV values have shown a slight decline, indicating a decrease in buying pressure.
- Chaikin Money Flow (CMF): The CMF values have been negative, suggesting a bearish sentiment.
Key Observation: Volume indicators point towards a slightly bearish outlook for the stock.
Conclusion:
Based on the analysis of the technical indicators, the next few days' possible stock price movement for CETF is likely to be upward due to the positive trend and momentum indicators. However, the narrowing Bollinger Bands and slightly negative volume indicators may lead to some consolidation or minor pullbacks in the short term. Overall, the stock is expected to maintain its positive momentum with potential for further upside movement.
Recommendation: Consider monitoring the price action closely for any signs of reversal or continuation patterns to make informed trading decisions.