Technical Analysis of CFA 2024-05-10
Overview:
In analyzing the provided Technical Analysis (TA) data for the last 5 days, we will delve into the trend, momentum, volatility, and volume indicators to forecast the possible stock price movement for the next few days. By examining these key indicators, we aim to provide a comprehensive and insightful analysis to guide your decision-making process.
Trend Indicators:
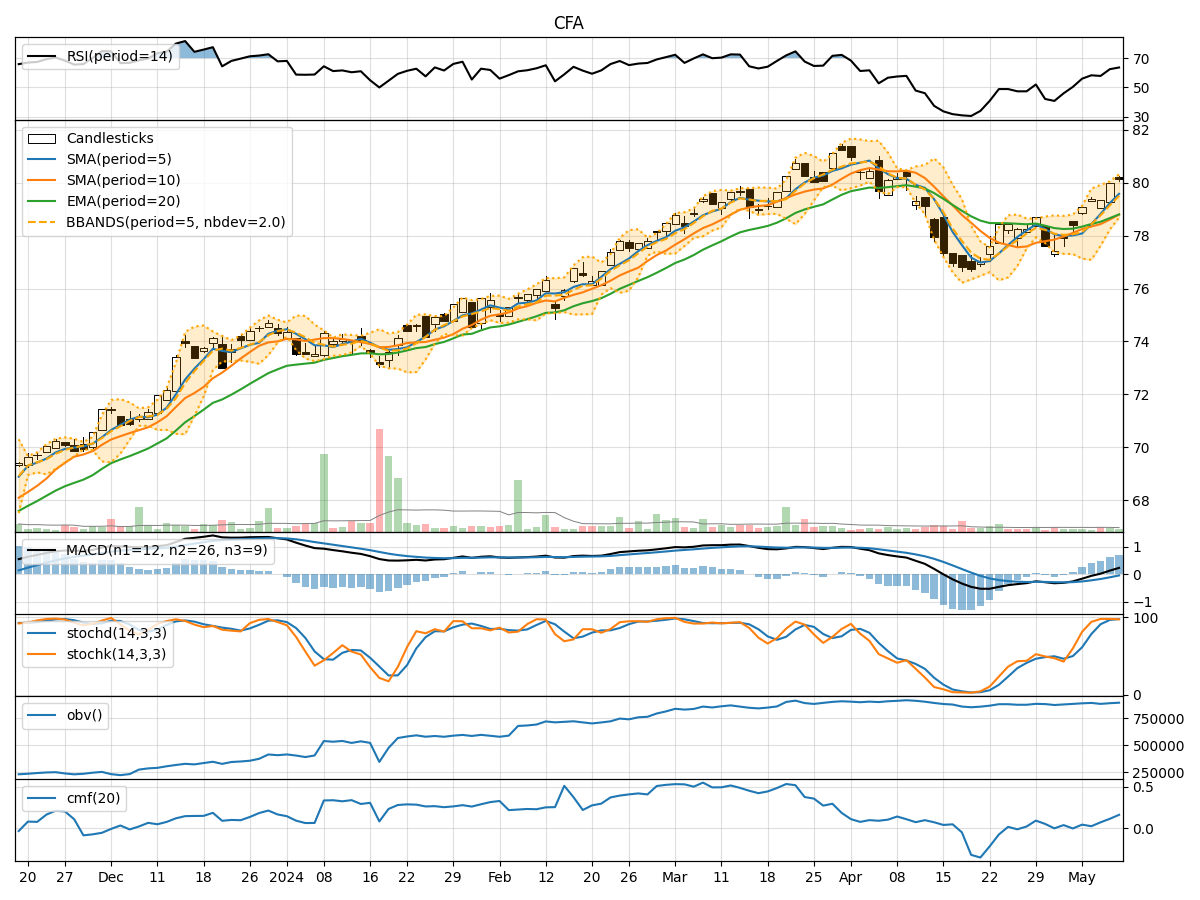
- Moving Averages (MA): The 5-day Moving Average (MA) has been consistently increasing, indicating a bullish trend in the short term.
- MACD: The Moving Average Convergence Divergence (MACD) has shown positive values, suggesting a bullish momentum.
- EMA: The Exponential Moving Average (EMA) has been trending upwards, supporting the bullish sentiment in the market.
Momentum Indicators:
- RSI: The Relative Strength Index (RSI) has been in the neutral to slightly overbought territory, indicating a balanced momentum.
- Stochastic Oscillator: Both %K and %D have been in the overbought zone, signaling a potential reversal or consolidation.
- Williams %R: The Williams %R is showing oversold conditions, suggesting a possible buying opportunity.
Volatility Indicators:
- Bollinger Bands: The Bollinger Bands have been narrowing, indicating decreasing volatility and a potential price breakout.
- Bollinger %B: The %B indicator is hovering around the middle range, suggesting a neutral stance in terms of volatility.
Volume Indicators:
- On-Balance Volume (OBV): The OBV has been steadily increasing, reflecting positive volume flow and potential accumulation.
- Chaikin Money Flow (CMF): The CMF has been on the rise, indicating buying pressure and bullish sentiment in the market.
Key Observations and Opinions:
- Trend: The trend indicators suggest a bullish outlook in the short term, supported by the positive moving averages and MACD.
- Momentum: The momentum indicators show a mixed picture with overbought signals from the stochastic oscillator and potential buying opportunities from Williams %R.
- Volatility: Volatility is decreasing based on the narrowing Bollinger Bands, hinting at a possible price breakout in the near future.
- Volume: The volume indicators point towards positive volume flow and buying pressure, aligning with the bullish sentiment in the market.
Conclusion:
Based on the analysis of the technical indicators, the next few days' possible stock price movement is likely to be upward with a potential breakout in price due to decreasing volatility and positive volume flow. Traders and investors may consider taking long positions or holding onto existing positions to capitalize on the expected bullish momentum in the market. However, it is essential to monitor the indicators closely for any signs of reversal or consolidation to adjust trading strategies accordingly.