Technical Analysis of CFO 2024-05-10
Overview:
In analyzing the provided Technical Analysis (TA) data for the last 5 days, we will delve into the trend, momentum, volatility, and volume indicators to forecast the possible stock price movement for the next few days. By examining these key indicators, we aim to provide a comprehensive and insightful analysis to guide your decision-making process.
Trend Indicators:
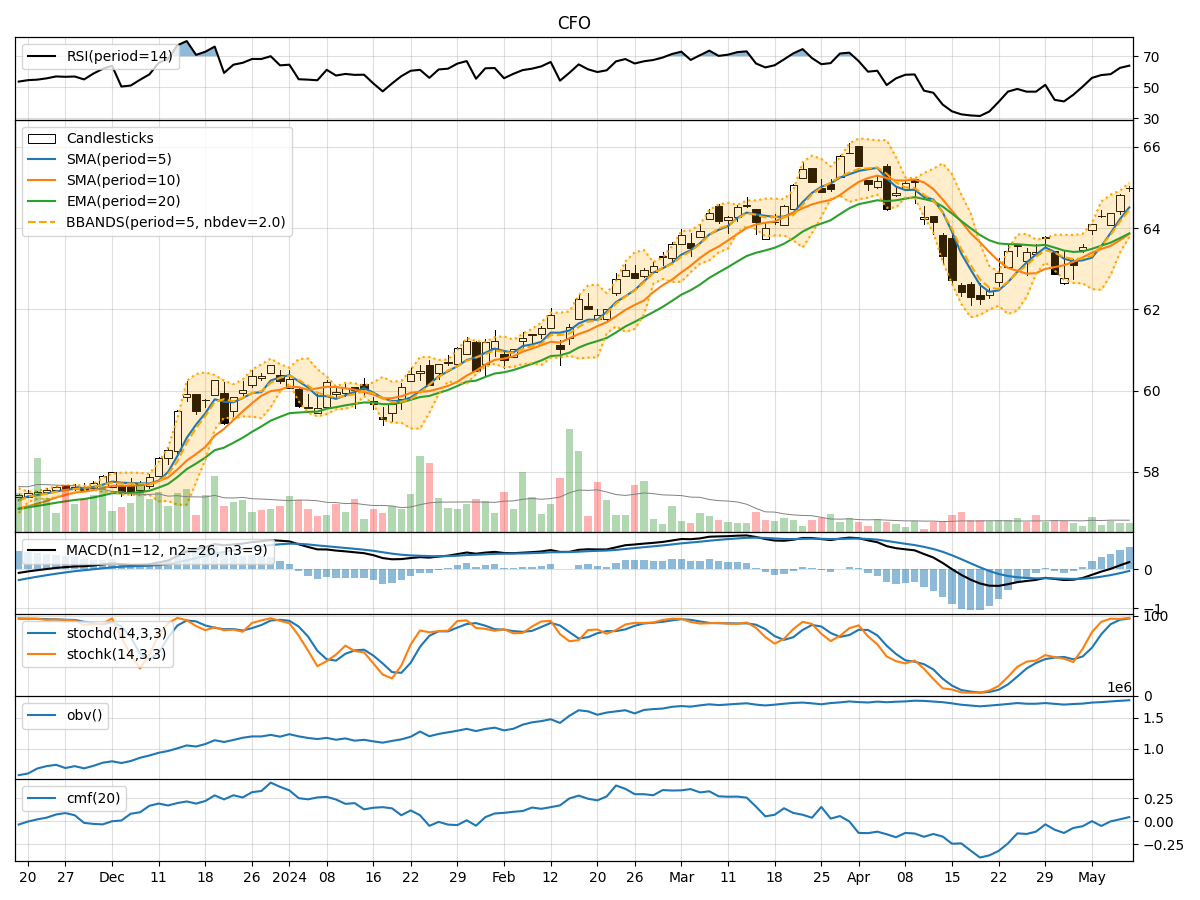
- Moving Averages (MA): The 5-day Moving Average (MA) has been consistently rising, indicating a bullish trend in the short term.
- MACD: The Moving Average Convergence Divergence (MACD) has shown positive values, suggesting a bullish momentum.
- EMA: The Exponential Moving Average (EMA) has been trending upwards, supporting the bullish sentiment.
Momentum Indicators:
- RSI: The Relative Strength Index (RSI) has been increasing, signaling strengthening momentum.
- Stochastic Oscillator: Both %K and %D values have been in the overbought territory, indicating a potential reversal or consolidation.
- Williams %R: The Williams %R is in the oversold region, suggesting a possible buying opportunity.
Volatility Indicators:
- Bollinger Bands: The Bollinger Bands have been widening, indicating increased volatility in the stock price.
- Bollinger %B: The %B value has been fluctuating, reflecting the price's relationship to the bands.
- Average True Range (ATR): ATR can provide insights into potential price movements based on historical volatility.
Volume Indicators:
- On-Balance Volume (OBV): The OBV has been increasing, suggesting accumulation by investors.
- Chaikin Money Flow (CMF): The CMF has been slightly negative, indicating some selling pressure.
Key Observations and Opinions:
- Trend: The stock is currently in an upward trend based on moving averages and MACD.
- Momentum: Momentum indicators suggest a bullish bias but show signs of potential overbought conditions.
- Volatility: Volatility has been increasing, which could lead to larger price swings.
- Volume: The increasing OBV indicates buying interest, while the slightly negative CMF suggests some selling pressure.
Conclusion:
Based on the analysis of the technical indicators, the next few days' possible stock price movement is likely to be upward with some potential for consolidation or a pullback due to overbought conditions in momentum indicators. Investors should closely monitor the price action, especially around key support and resistance levels, to capitalize on potential opportunities while managing risks effectively.