Technical Analysis of CGCB 2024-05-10
Overview:
In analyzing the technical indicators for CGCB over the last 5 days, we will delve into the trend, momentum, volatility, and volume indicators to provide a comprehensive outlook on the possible stock price movement in the coming days. By examining key metrics such as moving averages, MACD, RSI, Bollinger Bands, and OBV, we aim to offer valuable insights and recommendations for potential investors.
Trend Indicators:
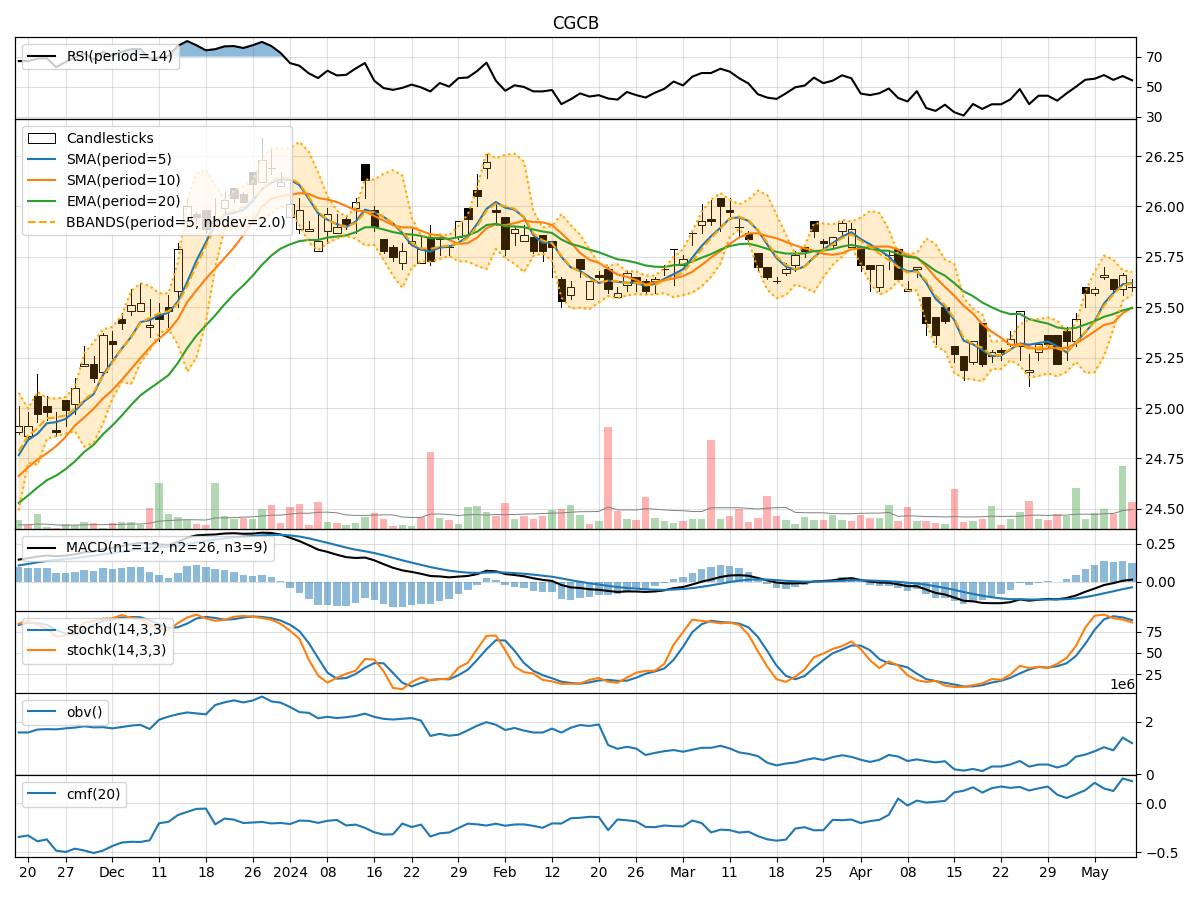
- Moving Averages (MA): The 5-day MA has been relatively stable around the current stock price, indicating a neutral trend.
- MACD: The MACD line has been consistently positive, suggesting a bullish momentum in the short term.
- MACD Histogram: The MACD histogram has shown a slight decrease but remains above the zero line, indicating a potential consolidation phase.
Momentum Indicators:
- RSI: The RSI has been fluctuating around the 50 level, indicating a lack of strong momentum in either direction.
- Stochastic Oscillator: Both %K and %D have been declining, signaling a potential bearish momentum.
- Williams %R: The Williams %R is in oversold territory, suggesting a possible reversal in the short term.
Volatility Indicators:
- Bollinger Bands: The stock price has been trading within the Bollinger Bands, indicating a period of consolidation.
- Bollinger %B: The %B indicator is below 1, suggesting the stock is trading below the lower band and may be oversold.
Volume Indicators:
- On-Balance Volume (OBV): The OBV has shown mixed signals with fluctuations in volume, indicating uncertainty among investors.
- Chaikin Money Flow (CMF): The CMF has been positive, suggesting buying pressure in the market.
Key Observations:
- The trend indicators show a neutral to slightly bullish outlook.
- Momentum indicators suggest a lack of strong momentum but a potential bearish bias.
- Volatility indicators point towards a period of consolidation.
- Volume indicators indicate mixed signals with no clear direction.
Conclusion:
Based on the analysis of the technical indicators, the next few days for CGCB stock price movement are likely to be sideways with a slight bearish bias. Investors should exercise caution and closely monitor key levels such as support and resistance to make informed trading decisions. It is advisable to wait for more clarity in the market before taking significant positions.