Technical Analysis of CGDG 2024-05-10
Overview:
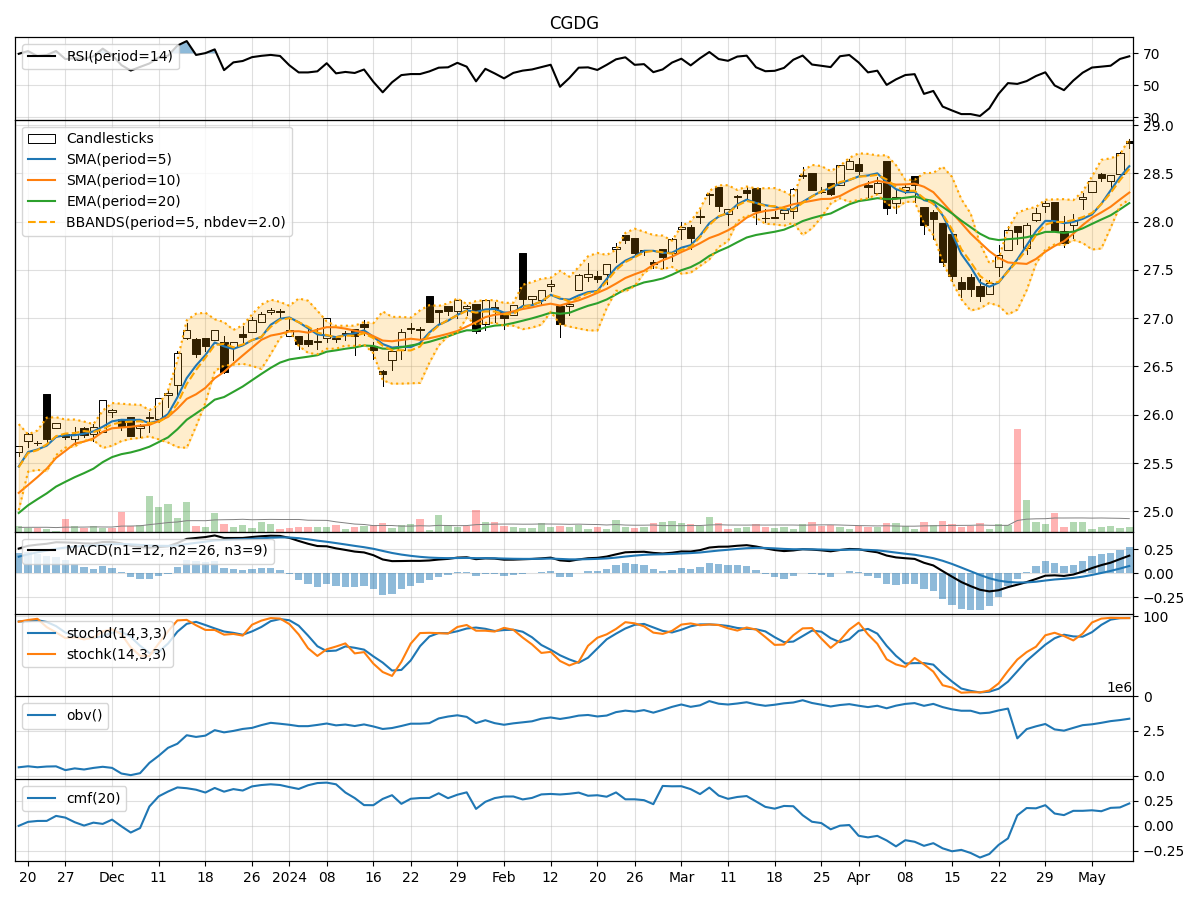
In analyzing the technical indicators for CGDG stock over the last 5 days, we will delve into the trend, momentum, volatility, and volume indicators to provide a comprehensive outlook on the possible stock price movement in the coming days.
Trend Indicators:
- Moving Averages (MA): The 5-day MA has been consistently above the closing prices, indicating a short-term uptrend.
- MACD: The MACD line has been above the signal line, suggesting bullish momentum.
- EMA: The EMA has been trending upwards, reflecting a positive price trend.
Momentum Indicators:
- RSI: The RSI has been in the overbought territory, indicating strong buying momentum.
- Stochastic Oscillator: Both %K and %D have been in the overbought zone, signaling a potential reversal.
- Williams %R: The indicator has been in the oversold region, suggesting a possible price bounce.
Volatility Indicators:
- Bollinger Bands (BB): The stock price has been trading within the bands, indicating normal volatility.
- BB Width: The bands have not shown significant expansion or contraction, suggesting stable price movement.
Volume Indicators:
- On-Balance Volume (OBV): The OBV has shown mixed signals, with some days seeing selling pressure and others showing accumulation.
- Chaikin Money Flow (CMF): The CMF has been positive, indicating buying pressure in the stock.
Key Observations and Opinions:
- Trend: The stock is in an upward trend based on moving averages and MACD.
- Momentum: The momentum indicators suggest a potential reversal due to overbought conditions.
- Volatility: Volatility is stable, with no significant changes in Bollinger Bands width.
- Volume: The volume indicators show mixed signals with alternating buying and selling pressure.
Conclusion:
Based on the analysis of the technical indicators, the next few days for CGDG stock could see a potential pullback or consolidation as momentum indicators signal overbought conditions. Traders should be cautious of a possible reversal in the short term. It is advisable to monitor price action closely for any signs of a trend reversal or continuation.