Technical Analysis of CGDV 2024-05-10
Overview:
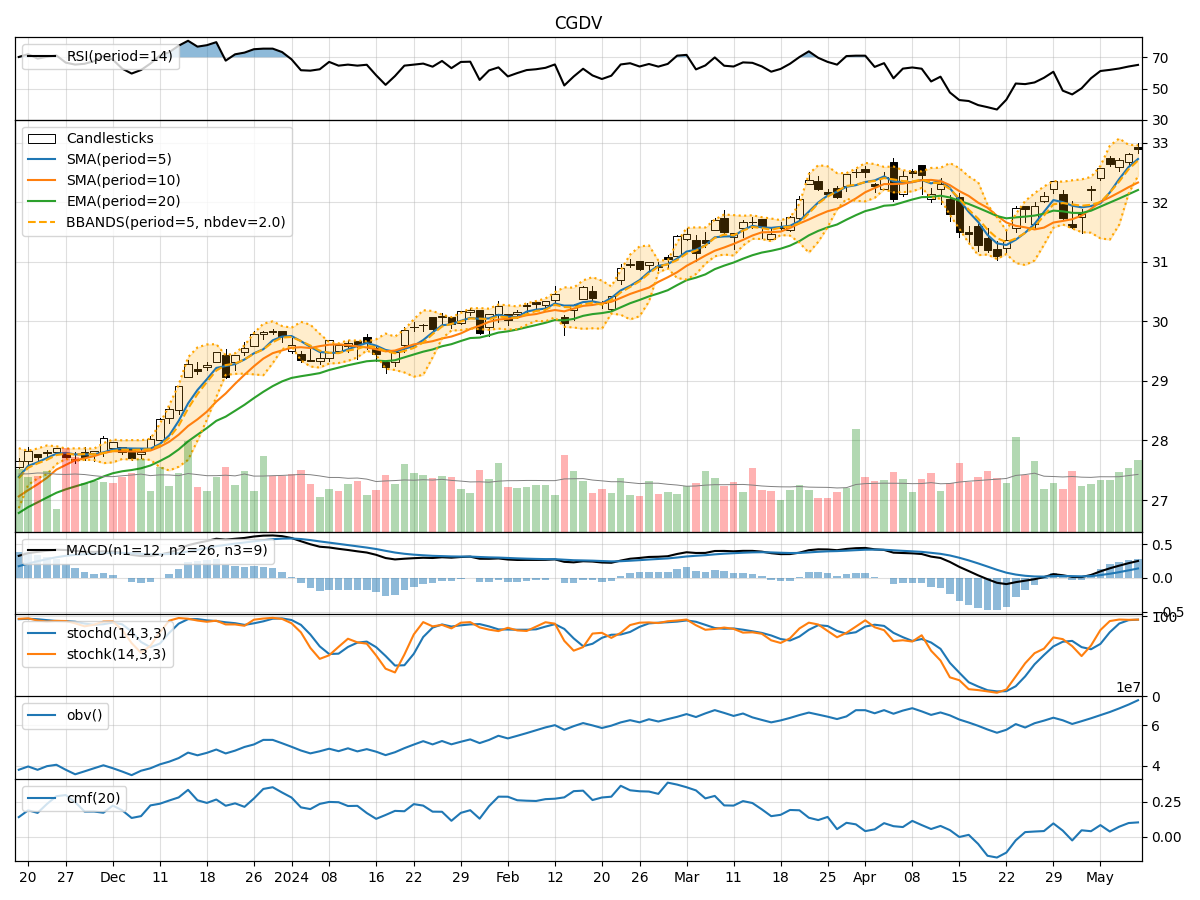
In analyzing the technical indicators for CGDV over the last 5 days, we will delve into the trend, momentum, volatility, and volume indicators to provide a comprehensive outlook on the possible stock price movement. By examining these key aspects, we aim to offer valuable insights and predictions for the upcoming days.
Trend Analysis:
- Moving Averages (MA): The 5-day Moving Average has been consistently rising, indicating a bullish trend in the short term.
- MACD: The MACD line has been above the signal line, suggesting positive momentum in the stock price.
- EMA: The Exponential Moving Average has been trending upwards, supporting the bullish sentiment.
Momentum Analysis:
- RSI: The Relative Strength Index has been increasing, showing strengthening buying momentum.
- Stochastic Oscillator: Both %K and %D have been in the overbought zone, indicating a potential reversal or consolidation.
- Williams %R: The indicator has been fluctuating around the oversold region, signaling a possible reversal.
Volatility Analysis:
- Bollinger Bands: The stock price has been trading within the bands, with the bands narrowing, suggesting a potential breakout or consolidation.
- Bollinger %B: The %B indicator has been fluctuating, indicating potential shifts in volatility.
Volume Analysis:
- On-Balance Volume (OBV): The OBV has been steadily increasing, reflecting strong buying pressure.
- Chaikin Money Flow (CMF): The CMF has been positive, indicating money flow into the stock.
Key Observations:
- The trend indicators suggest a bullish sentiment in the short term.
- Momentum indicators show mixed signals with potential for a reversal or consolidation.
- Volatility indicators point towards a potential breakout or consolidation.
- Volume indicators indicate strong buying pressure in the stock.
Conclusion:
Based on the analysis of the technical indicators, the next few days for CGDV are likely to see upward movement in the stock price. The bullish trend supported by moving averages and MACD, coupled with increasing RSI and OBV, indicates a positive outlook. However, caution is advised as stochastic indicators suggest a potential reversal or consolidation. Traders should monitor the stock closely for any signs of a shift in momentum or volatility.