Technical Analysis of CGGO 2024-05-10
Overview:
In analyzing the technical indicators for CGGO over the last 5 days, we will delve into the trend, momentum, volatility, and volume indicators to provide a comprehensive outlook on the possible stock price movement in the coming days. By examining these key indicators, we aim to offer valuable insights and predictions to guide investment decisions.
Trend Indicators:
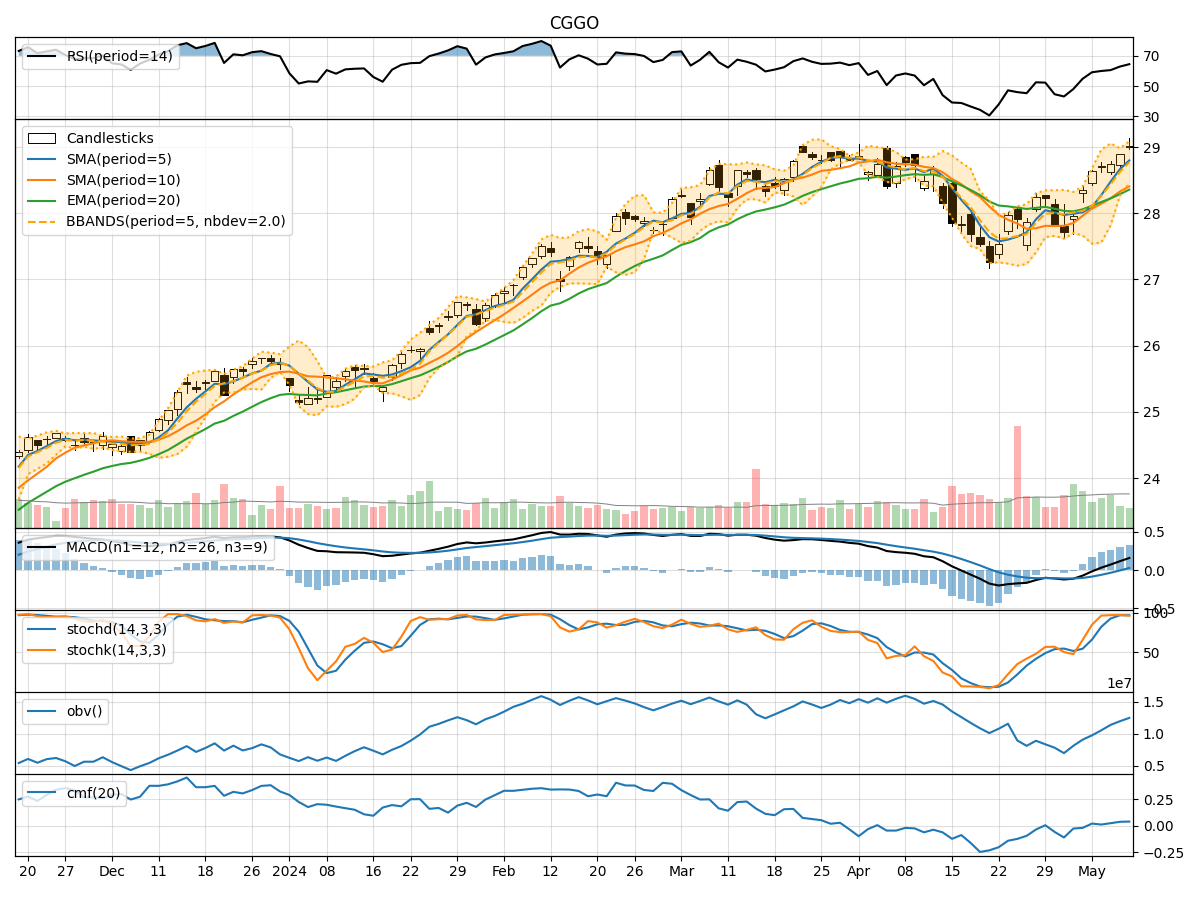
- Moving Averages (MA): The 5-day MA has been consistently above the closing prices, indicating a bullish trend.
- MACD: The MACD line has been consistently above the signal line, suggesting a bullish momentum.
- EMA: The EMA has been trending upwards, supporting the bullish sentiment in the short to medium term.
Momentum Indicators:
- RSI: The RSI has been gradually increasing, indicating strengthening buying momentum.
- Stochastic Oscillator: Both %K and %D have been in the overbought zone, suggesting a potential reversal or consolidation.
- Williams %R: The indicator has been fluctuating around oversold levels, signaling a possible reversal.
Volatility Indicators:
- Bollinger Bands: The stock price has been trading within the bands, indicating normal volatility.
- Bollinger %B: The %B indicator has been fluctuating around the midline, suggesting a balanced market sentiment.
Volume Indicators:
- On-Balance Volume (OBV): The OBV has been showing a slight decrease, indicating some distribution.
- Chaikin Money Flow (CMF): The CMF has been positive, reflecting buying pressure in the market.
Key Observations:
- The trend indicators suggest a bullish sentiment in the short to medium term.
- Momentum indicators show a mix of bullish and potential reversal signals.
- Volatility remains relatively stable, with no extreme movements.
- Volume indicators indicate a slight decrease in buying pressure but overall positive sentiment.
Conclusion:
Based on the analysis of the technical indicators, the stock price of CGGO is likely to experience further upward movement in the coming days. The bullish trend supported by moving averages and MACD, coupled with positive momentum indicated by RSI, suggests a favorable outlook. While some indicators hint at potential reversals or consolidation, the overall picture remains bullish. Traders and investors may consider buying opportunities in CGGO based on the current technical analysis.