Technical Analysis of CGGR 2024-05-10
Overview:
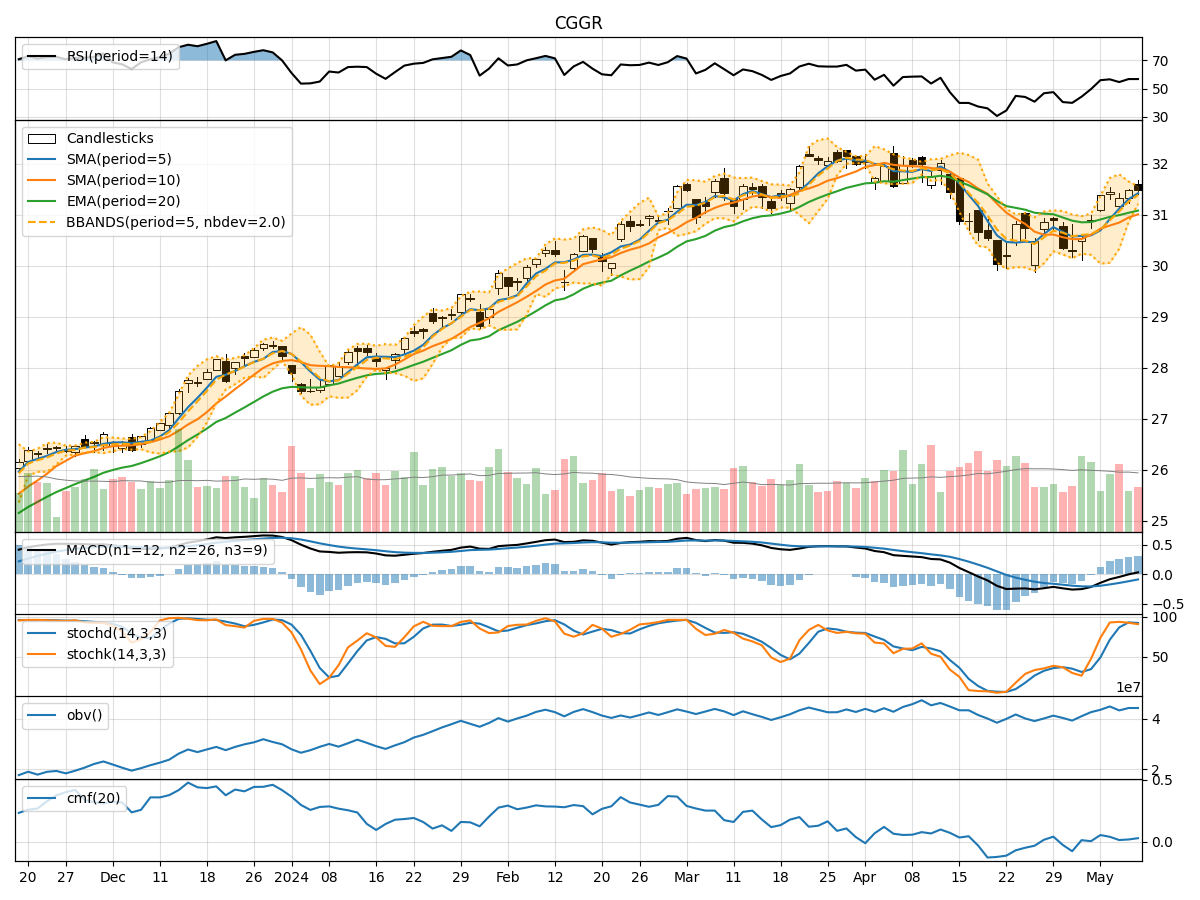
In analyzing the technical indicators for CGGR stock over the last 5 days, we will delve into the trend, momentum, volatility, and volume indicators to provide a comprehensive outlook on the possible stock price movement in the coming days. By examining key metrics such as moving averages, MACD, RSI, Bollinger Bands, and OBV, we aim to offer valuable insights and predictions for potential price action.
Trend Indicators:
- Moving Averages (MA): The 5-day MA has been consistently rising, indicating a bullish trend in the short term.
- MACD: The MACD line has been above the signal line, suggesting a positive momentum in the stock price.
- EMA: The EMA has been trending upwards, supporting the bullish sentiment.
Momentum Indicators:
- RSI: The RSI has been fluctuating around the 50 level, indicating a neutral momentum in the stock.
- Stochastic Oscillator: Both %K and %D have been in the overbought territory, signaling a potential reversal or consolidation.
Volatility Indicators:
- Bollinger Bands: The stock price has been trading within the bands, suggesting a period of consolidation.
- Bollinger %B: The %B indicator is hovering around the midline, indicating a balanced market sentiment.
Volume Indicators:
- On-Balance Volume (OBV): The OBV has shown mixed signals, reflecting indecision among investors.
- Chaikin Money Flow (CMF): The CMF has been relatively low, indicating a lack of strong buying or selling pressure.
Key Observations:
- The stock is currently in a short-term bullish trend based on moving averages and MACD.
- Momentum indicators suggest a neutral stance with potential for a reversal.
- Volatility indicators point towards a period of consolidation.
- Volume indicators show mixed signals with no clear direction in investor sentiment.
Conclusion:
Based on the analysis of the technical indicators, the next few days for CGGR stock are likely to see sideways movement or consolidation. The bullish trend indicated by moving averages and MACD may face resistance due to neutral momentum and lack of strong buying pressure. Investors should exercise caution and closely monitor key support and resistance levels for potential entry or exit points. It is advisable to wait for clearer signals or confirmation of a new trend direction before making significant trading decisions.