Technical Analysis of CGMS 2024-05-10
Overview:
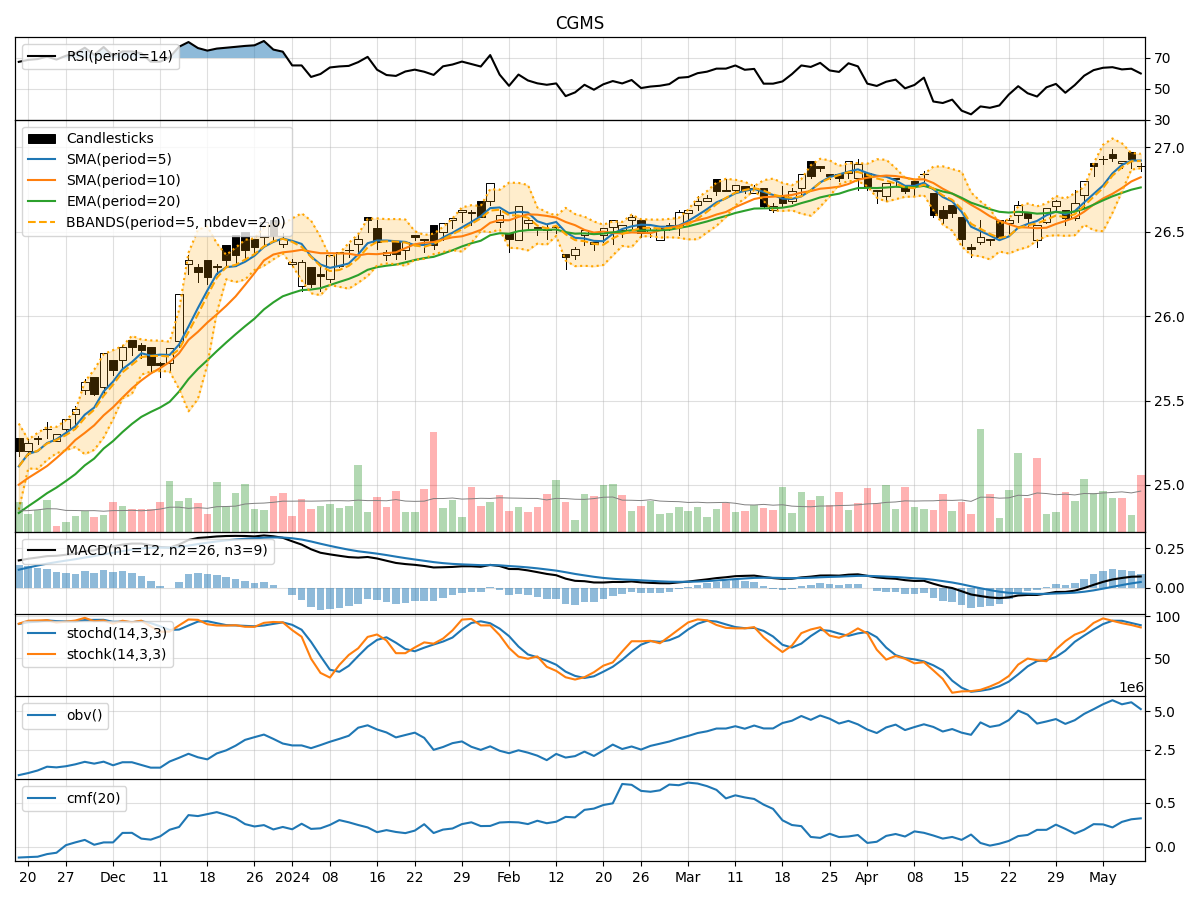
In analyzing the technical indicators for CGMS stock over the last 5 days, we will delve into the trends, momentum, volatility, and volume indicators to provide a comprehensive outlook on the possible stock price movement in the coming days. By examining key metrics such as moving averages, MACD, RSI, Bollinger Bands, and OBV, we aim to offer valuable insights and predictions for investors.
Trend Indicators:
- Moving Averages (MA): The 5-day moving average has been consistently above the closing prices, indicating a short-term uptrend.
- MACD: The MACD line has been trending upwards, with the MACD histogram showing positive values, suggesting bullish momentum.
- EMA: The exponential moving average has been steadily increasing, supporting the bullish trend.
Momentum Indicators:
- RSI: The Relative Strength Index has been fluctuating around the neutral zone, indicating a balanced momentum.
- Stochastic Oscillator: Both %K and %D have been gradually decreasing, signaling a potential reversal in momentum.
- Williams %R: The indicator has been in oversold territory, suggesting a possible buying opportunity.
Volatility Indicators:
- Bollinger Bands: The bands have been narrowing, indicating decreasing volatility and a potential price breakout.
- Bollinger %B: The %B indicator is currently at a low level, suggesting a possible oversold condition.
Volume Indicators:
- On-Balance Volume (OBV): The OBV has been fluctuating, indicating mixed buying and selling pressure.
- Chaikin Money Flow (CMF): The CMF has been positive, reflecting buying pressure in the market.
Key Observations and Opinions:
- Trend: The stock is in an upward trend based on moving averages and MACD.
- Momentum: Momentum indicators suggest a neutral to slightly bearish sentiment.
- Volatility: Bollinger Bands indicate low volatility and a potential price breakout.
- Volume: Volume indicators show mixed signals with fluctuating OBV and positive CMF.
Conclusion:
Based on the analysis of technical indicators, the next few days for CGMS stock may see sideways consolidation with a slight bearish bias. Investors should closely monitor the price action for potential entry or exit points. It is advisable to wait for confirmation signals before making any significant trading decisions.