Technical Analysis of CGMU 2024-05-10
Overview:
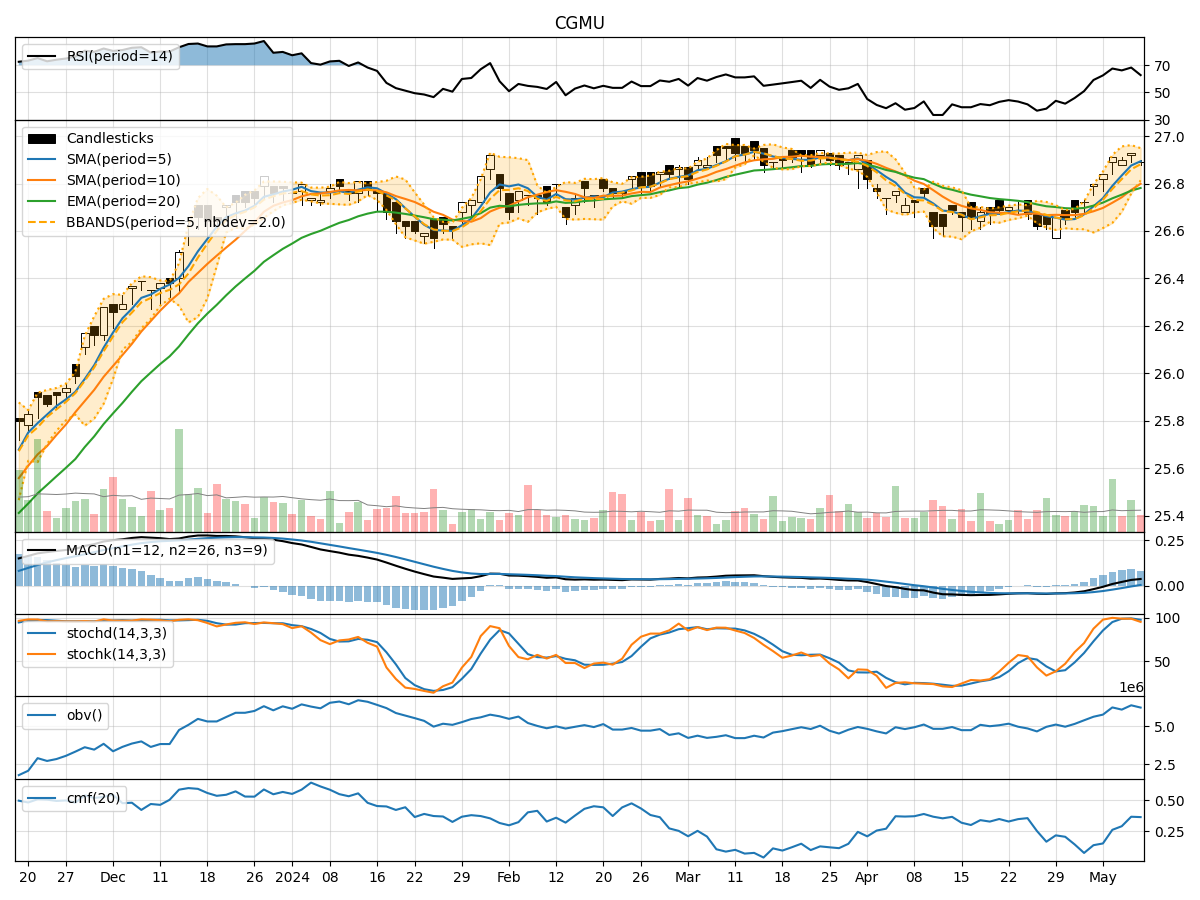
In the last 5 trading days, CGMU stock has shown a relatively stable performance with minor fluctuations in price and volume. The technical indicators across trend, momentum, volatility, and volume provide valuable insights into the stock's potential future movements. Let's analyze each category of indicators to determine the possible stock price movement in the next few days.
Trend Indicators:
- Moving Averages (MA): The 5-day Moving Average (MA) has been consistently above the Simple Moving Average (SMA) and Exponential Moving Average (EMA), indicating a short-term uptrend.
- MACD: The MACD line has been consistently above the signal line, with the MACD histogram showing positive values, suggesting bullish momentum.
Momentum Indicators:
- RSI: The Relative Strength Index (RSI) has been fluctuating around the overbought territory, indicating strong buying pressure.
- Stochastic Oscillator: Both %K and %D lines of the Stochastic Oscillator have been in the overbought zone, suggesting a potential reversal or consolidation.
Volatility Indicators:
- Bollinger Bands (BB): The stock price has mostly stayed within the Bollinger Bands, with the bands narrowing, indicating decreasing volatility.
Volume Indicators:
- On-Balance Volume (OBV): The OBV has shown a slight increase over the last 5 days, indicating accumulation by investors.
- Chaikin Money Flow (CMF): The CMF has been positive, suggesting money flow into the stock.
Key Observations:
- The trend indicators suggest a bullish sentiment in the short term.
- Momentum indicators show a potential overbought condition, signaling a need for caution.
- Volatility has been decreasing, indicating a possible period of consolidation.
- Volume indicators reflect positive accumulation and money flow into the stock.
Conclusion:
Based on the analysis of technical indicators, the next few days for CGMU stock are likely to see continued upward movement in price, supported by the bullish trend and positive money flow. However, the overbought signals from momentum indicators and narrowing volatility suggest a possible consolidation phase in the near future. Investors should monitor the stock closely for any signs of a reversal or correction.