Technical Analysis of CGSD 2024-05-10
Overview:
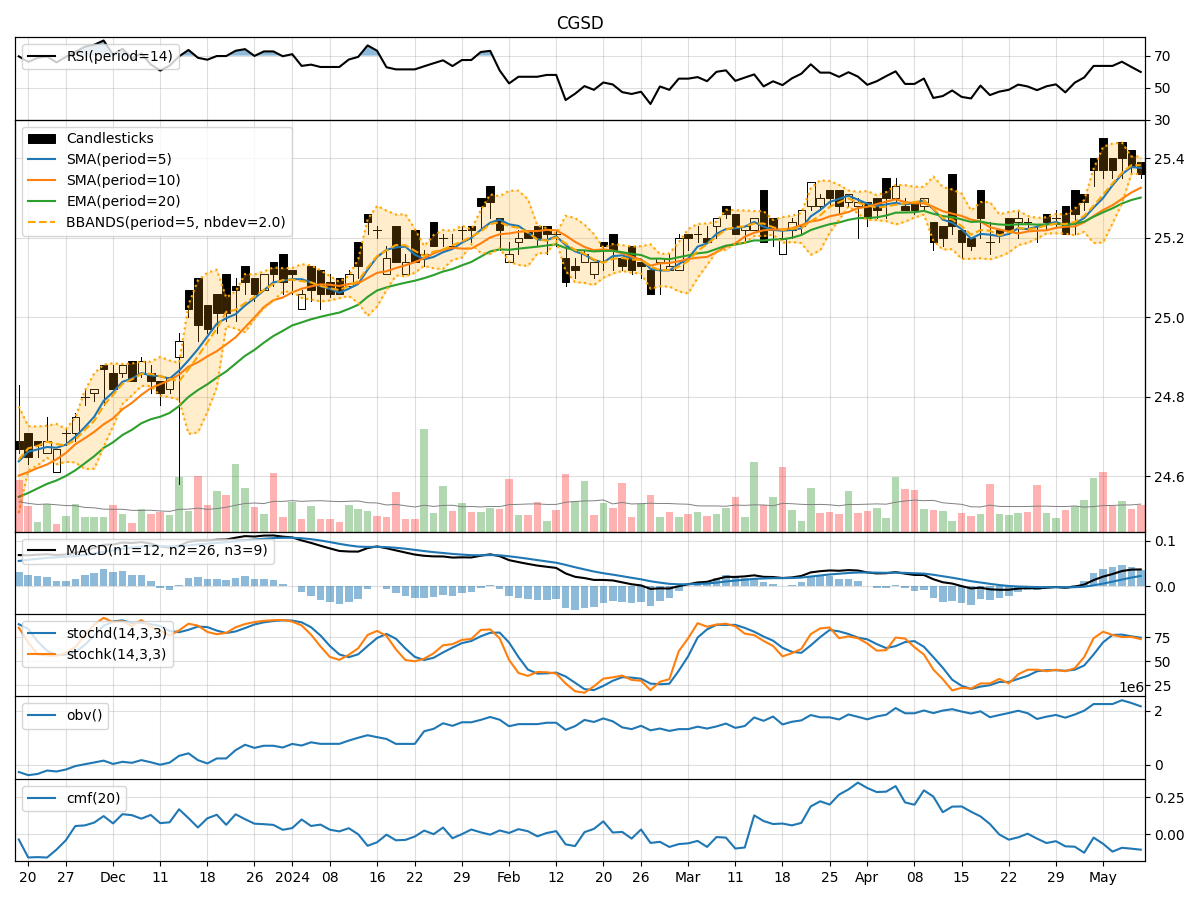
In analyzing the technical indicators for CGSD stock over the last 5 days, we will delve into the trend, momentum, volatility, and volume indicators to provide a comprehensive outlook on the possible stock price movement in the coming days. By examining key metrics such as moving averages, MACD, RSI, Bollinger Bands, and OBV, we aim to offer valuable insights and predictions for potential price trends.
Trend Indicators:
- Moving Averages (MA): The 5-day MA has been consistently above the closing prices, indicating a short-term uptrend.
- MACD: The MACD line has been positive and increasing, suggesting bullish momentum.
- EMA: The EMA has been trending upwards, supporting the bullish sentiment.
- Conclusion: The trend indicators point towards an upward movement in the stock price.
Momentum Indicators:
- RSI: The RSI has been fluctuating around the overbought territory, indicating strong buying pressure.
- Stochastic Oscillator: Both %K and %D have been relatively high, signaling bullish momentum.
- Williams %R: The indicator has been in the oversold region, suggesting a potential reversal.
- Conclusion: Momentum indicators suggest a bullish outlook for the stock.
Volatility Indicators:
- Bollinger Bands (BB): The bands have been narrowing, indicating decreasing volatility.
- Conclusion: Volatility is decreasing, which could lead to a period of consolidation or a potential breakout.
Volume Indicators:
- On-Balance Volume (OBV): The OBV has been fluctuating but not showing a clear trend.
- Chaikin Money Flow (CMF): The CMF has been negative, indicating selling pressure.
- Conclusion: Volume indicators are mixed, with no clear direction for the stock price.
Overall Conclusion:
Based on the analysis of trend, momentum, volatility, and volume indicators, the stock is likely to experience an upward movement in the coming days. The bullish trend supported by moving averages and MACD, coupled with strong momentum indicated by RSI and Stochastic Oscillator, suggests a positive outlook. However, the decreasing volatility and mixed volume signals may lead to some consolidation before a potential breakout. Traders should consider entering long positions with caution and closely monitor key support and resistance levels for confirmation of the upward trend.
Key Recommendations:
- Consider Long Positions: Based on the bullish trend and momentum indicators, investors may consider long positions in CGSD stock.
- Monitor Volatility: Keep an eye on the decreasing volatility for potential breakout opportunities.
- Set Stop-Loss: Implementing stop-loss orders can help manage risk in case of unexpected price movements.
- Stay Informed: Continuously monitor market news and updates that could impact the stock price.
In conclusion, the technical analysis suggests a bullish outlook for CGSD stock in the near term, but traders should exercise caution and implement risk management strategies to navigate potential market fluctuations.