Technical Analysis of CGUS 2024-05-10
Overview:
In analyzing the technical indicators for CGUS over the last 5 days, we will delve into the trend, momentum, volatility, and volume indicators to provide a comprehensive outlook on the possible stock price movement in the coming days. By examining these key indicators, we aim to offer valuable insights and predictions for potential investors.
Trend Indicators:
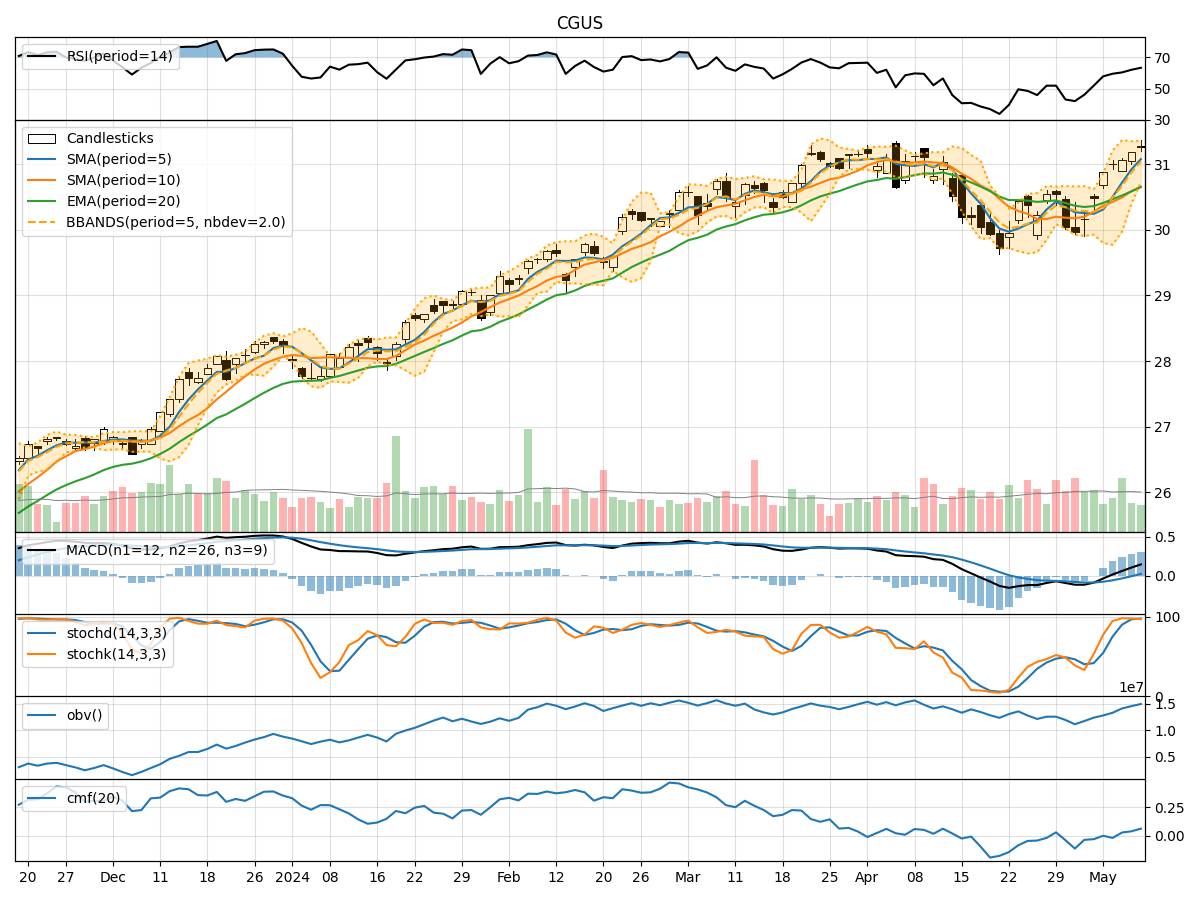
- Moving Averages (MA): The 5-day MA has been consistently above the 10-day SMA, indicating a short-term bullish trend. The EMA(20) has been steadily increasing, reflecting positive momentum.
- MACD: The MACD line has been above the signal line for the past 5 days, suggesting bullish momentum.
- MACD Histogram: The MACD histogram has been consistently positive, indicating increasing bullish momentum.
Momentum Indicators:
- RSI: The RSI has been trending upwards and is currently in the overbought territory, suggesting a strong bullish momentum.
- Stochastic Oscillator: Both %K and %D lines of the Stochastic Oscillator have been in the overbought zone, indicating a potential reversal or consolidation.
- Williams %R: The Williams %R is in the oversold region, signaling a potential reversal to the upside.
Volatility Indicators:
- Bollinger Bands: The stock price has been trading within the upper Bollinger Band, indicating an overbought condition.
- Bollinger Band Width: The Band Width has been narrowing, suggesting a decrease in volatility.
- Bollinger Band %B: The %B indicator is above 0.8, indicating a potential overbought condition.
Volume Indicators:
- On-Balance Volume (OBV): The OBV has shown mixed signals, with some days experiencing selling pressure and others showing accumulation.
- Chaikin Money Flow (CMF): The CMF has been positive, indicating buying pressure in the stock.
Conclusion:
Based on the analysis of the technical indicators, the stock of CGUS is currently exhibiting strong bullish momentum in the short term. However, some indicators like the Stochastic Oscillator suggest a potential reversal or consolidation due to overbought conditions. The narrowing Bollinger Band Width also indicates decreasing volatility.
Forecast:
Given the current technical setup, the next few days may see a continuation of the bullish trend with a possibility of a minor pullback or consolidation. Investors should closely monitor key levels such as the support from moving averages and the upper Bollinger Band for potential entry or exit points. It is essential to exercise caution and consider risk management strategies in light of the mixed signals from various indicators.