Technical Analysis of CGW 2024-05-10
Overview:
In analyzing the technical indicators for CGW over the last 5 days, we will delve into the trend, momentum, volatility, and volume indicators to provide a comprehensive outlook on the possible stock price movement in the coming days.
Trend Analysis:
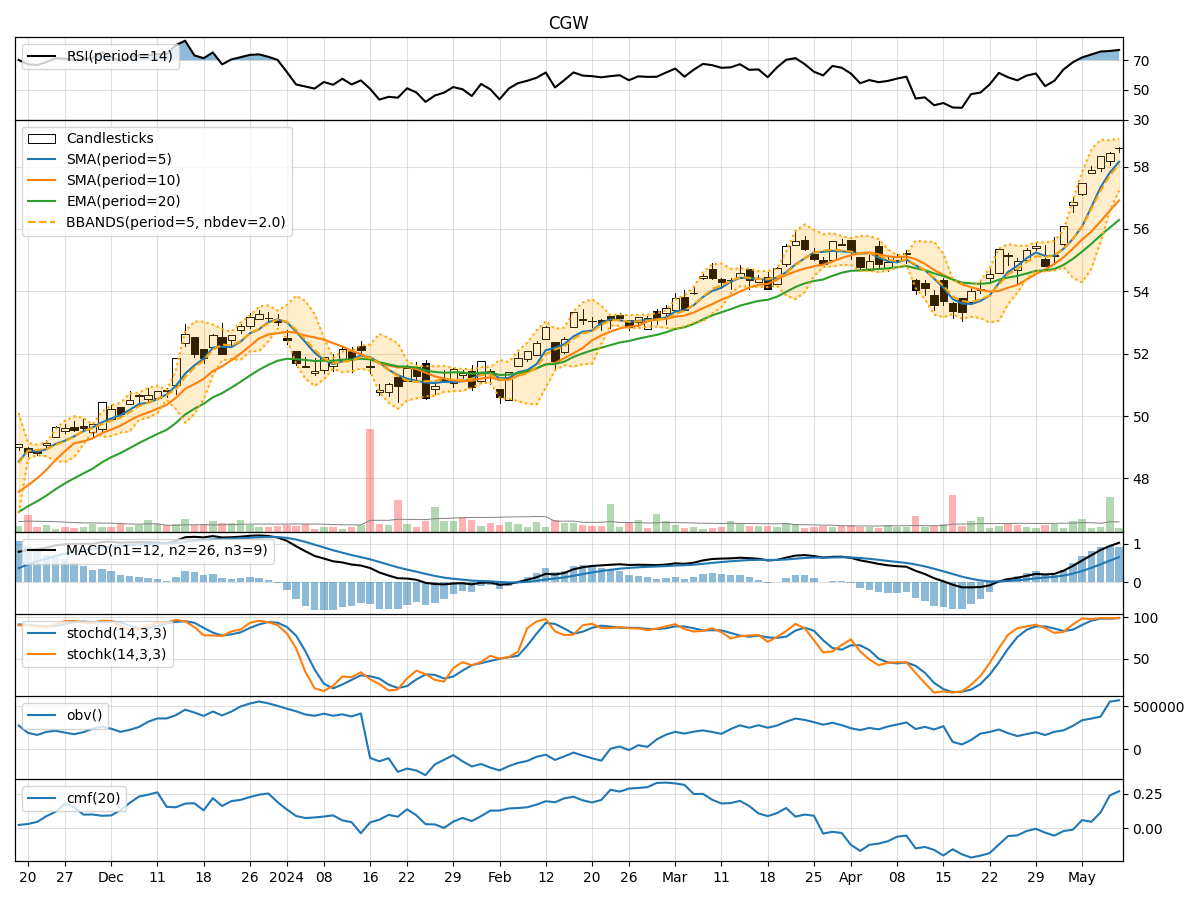
- Moving Averages (MA): The 5-day Moving Average has been consistently rising, indicating an upward trend in the stock price.
- MACD: The MACD line has been above the signal line, with both lines showing an increasing trend, suggesting bullish momentum.
- RSI: The Relative Strength Index has been in the overbought territory, indicating a strong bullish momentum.
Key Observation: The trend indicators point towards a strong bullish trend in the stock price.
Momentum Analysis:
- Stochastic Oscillator: Both %K and %D have been in the overbought zone, signaling a strong buying momentum.
- Williams %R: The indicator has been consistently in the oversold region, indicating a potential reversal in the stock price.
Key Observation: Momentum indicators suggest a continuation of the bullish momentum in the stock.
Volatility Analysis:
- Bollinger Bands: The stock price has been consistently trading above the middle Bollinger Band, indicating an uptrend with low volatility.
Key Observation: Volatility indicators suggest a stable uptrend with limited price fluctuations.
Volume Analysis:
- On-Balance Volume (OBV): The OBV has been steadily increasing, indicating strong buying pressure in the stock.
- Chaikin Money Flow (CMF): The CMF has been positive, reflecting a healthy inflow of money into the stock.
Key Observation: Volume indicators support the bullish sentiment in the stock.
Conclusion:
Based on the analysis of the technical indicators, the next few days' possible stock price movement for CGW is upward. The trend indicators, momentum indicators, volatility indicators, and volume indicators all point towards a continuation of the bullish trend. Investors may consider maintaining or initiating long positions in CGW based on the current technical analysis.
Disclaimer:
This analysis is based solely on technical indicators and historical data. It is essential to consider other fundamental factors and market dynamics before making any investment decisions. Consulting with a financial advisor is recommended to align investment strategies with individual goals and risk tolerance levels.