Technical Analysis of CGXU 2024-05-10
Overview:
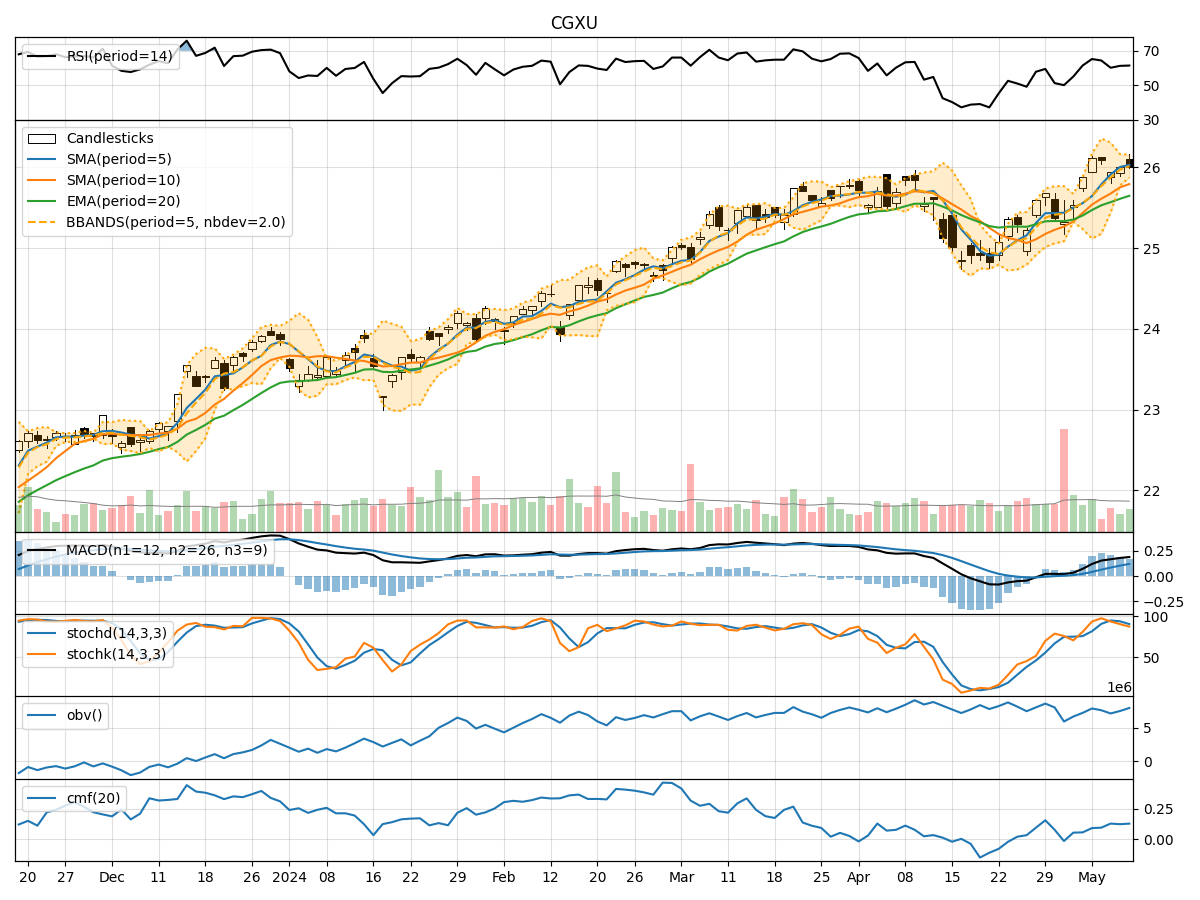
In analyzing the technical indicators for CGXU over the last 5 days, we will delve into the trend, momentum, volatility, and volume indicators to provide a comprehensive outlook on the possible stock price movement in the coming days.
Trend Analysis:
- Moving Averages (MA): The 5-day MA has been consistently above the closing prices, indicating a bullish trend.
- MACD: The MACD line has been above the signal line, suggesting a bullish momentum.
- RSI: The RSI has been fluctuating around the 60-65 range, indicating a neutral to slightly bullish sentiment.
Momentum Analysis:
- Stochastic Oscillator: The Stochastic Oscillator has been gradually decreasing but remains in the overbought territory, signaling a potential reversal.
- Williams %R: The Williams %R has been hovering around oversold levels, indicating a possible buying opportunity.
Volatility Analysis:
- Bollinger Bands: The stock price has been trading within the Bollinger Bands, with the bands narrowing, suggesting a period of consolidation.
- Volatility: The volatility has been decreasing, indicating a potential decrease in price fluctuations.
Volume Analysis:
- On-Balance Volume (OBV): The OBV has been increasing, reflecting accumulation by investors.
- Chaikin Money Flow (CMF): The CMF has been positive, indicating buying pressure in the stock.
Key Observations:
- The trend indicators suggest a bullish sentiment in the short term.
- Momentum indicators show a potential reversal in the overbought territory.
- Volatility indicators point towards a period of consolidation.
- Volume indicators indicate accumulation and buying pressure.
Conclusion:
Based on the analysis of the technical indicators, the next few days for CGXU are likely to see sideways movement with a slight bullish bias. Traders may consider buying on dips as the stock consolidates within a narrow range. However, it is essential to monitor the Stochastic Oscillator for a potential reversal and the RSI for any signs of overbought conditions. Overall, the stock is expected to maintain its current trend with minor fluctuations.