Technical Analysis of CHAI 2024-05-10
Overview:
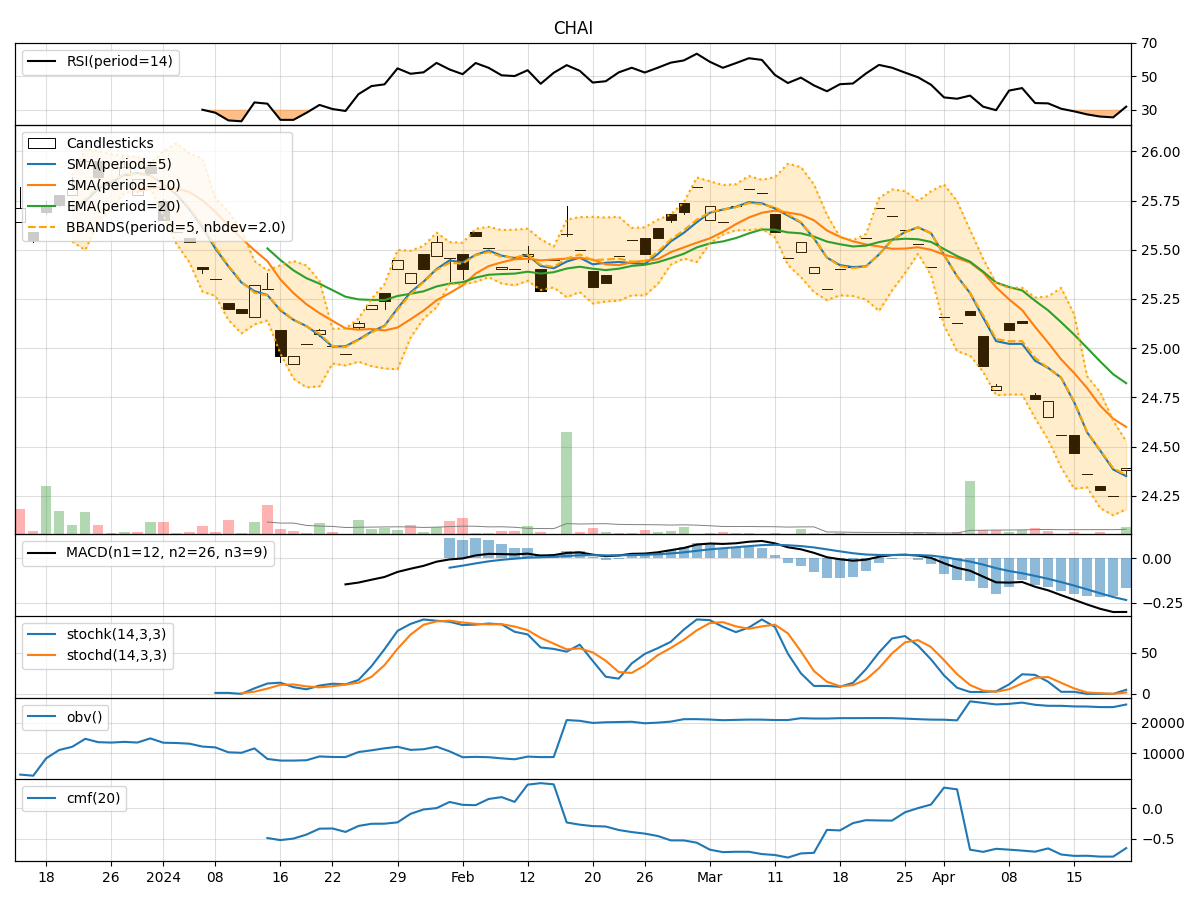
In analyzing the technical indicators for CHAI stock over the last 5 days, we will delve into the trends, momentum, volatility, and volume aspects to provide a comprehensive outlook on the possible stock price movement in the coming days. By examining key indicators such as moving averages, MACD, RSI, Bollinger Bands, and OBV, we aim to offer valuable insights and predictions for potential price action.
Trend Analysis:
- Moving Averages (MA): The 5-day MA has been consistently above the closing prices, indicating a short-term uptrend.
- MACD: The MACD line has been negative but moving closer to the signal line, suggesting a potential bullish crossover.
- EMA: The EMA has been gradually increasing, reflecting a positive trend in the stock price.
Momentum Analysis:
- RSI: The RSI has been hovering around the neutral zone, indicating a balanced momentum in the stock.
- Stochastic Oscillator: Both %K and %D have been declining, signaling a potential weakening momentum.
- Williams %R: The indicator is in the oversold territory, suggesting a possible reversal in the short term.
Volatility Analysis:
- Bollinger Bands: The stock price has been trading within the bands, indicating a period of consolidation.
- Bollinger %B: The %B indicator is close to 0.5, suggesting a balanced volatility in the stock.
Volume Analysis:
- On-Balance Volume (OBV): The OBV has been relatively flat, indicating a lack of significant buying or selling pressure.
- Chaikin Money Flow (CMF): The CMF has been positive, reflecting a net inflow of money into the stock.
Key Observations:
- The stock is currently in a consolidation phase, as indicated by the Bollinger Bands and the flat OBV.
- Momentum is showing signs of weakness with declining stochastic indicators and an oversold Williams %R.
- The trend is slightly bullish based on the moving averages and EMA.
Conclusion:
Based on the analysis of the technical indicators, the stock is likely to continue trading sideways in the near term with a potential for a slight upward bias. Traders should exercise caution and wait for clearer signals of a trend reversal before making significant trading decisions. It is advisable to monitor the momentum indicators closely for any signs of a shift in market sentiment.