Technical Analysis of CHAT 2024-05-10
Overview:
In analyzing the technical indicators for the stock over the last 5 days, we will delve into the trends, momentum, volatility, and volume aspects to provide a comprehensive outlook on the possible stock price movement in the coming days. By examining key indicators such as moving averages, MACD, RSI, Bollinger Bands, and OBV, we aim to offer valuable insights and predictions for informed decision-making.
Trend Analysis:
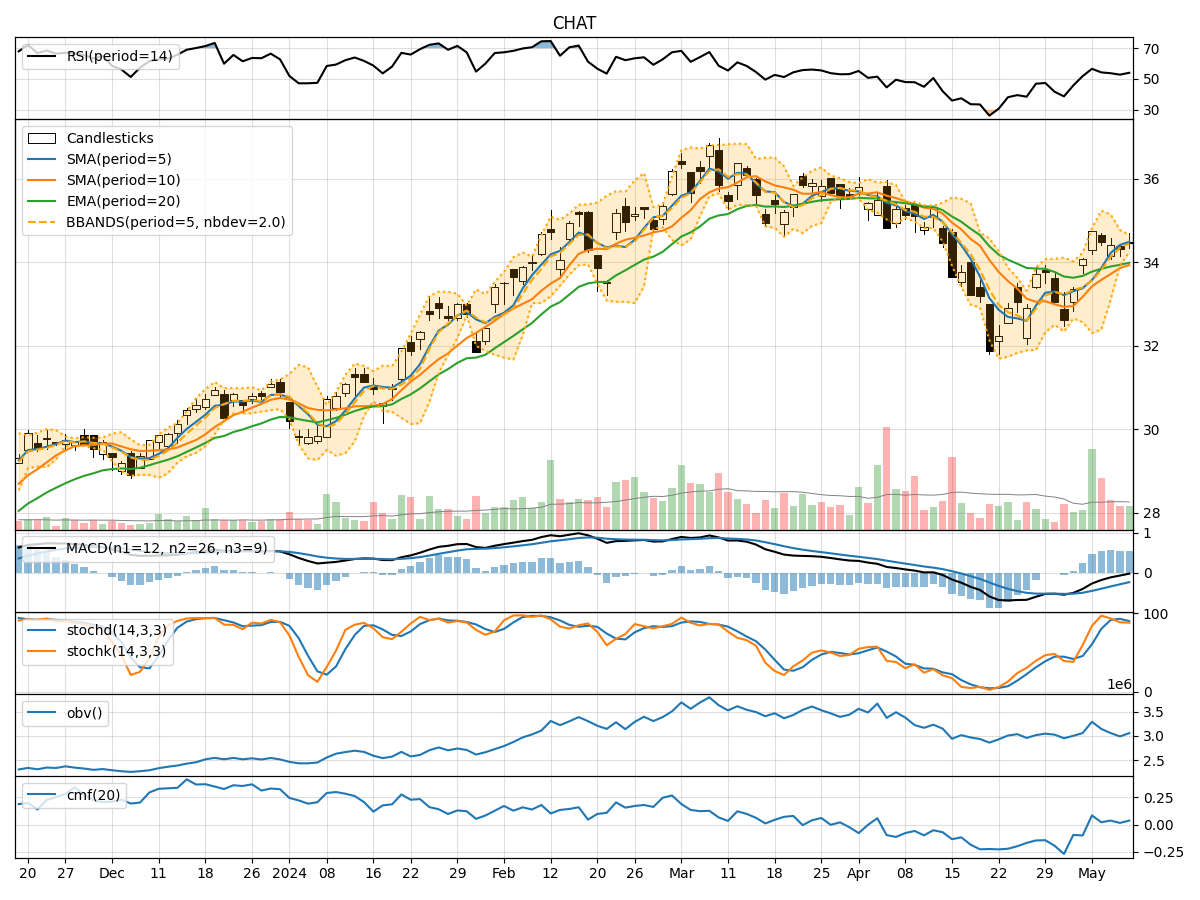
- Moving Averages (MA): The 5-day moving average has been consistently above the closing prices, indicating a bullish trend.
- MACD: The MACD line has been below the signal line, suggesting a bearish momentum.
- EMA: The exponential moving average has been trending slightly upwards, signaling a potential bullish sentiment.
Momentum Analysis:
- RSI: The Relative Strength Index has been fluctuating around the neutral zone, indicating indecision in the market.
- Stochastic Oscillator: Both %K and %D have been hovering around overbought levels, suggesting a possible reversal.
- Williams %R: The indicator has been oscillating near oversold territory, hinting at a potential buying opportunity.
Volatility Analysis:
- Bollinger Bands: The stock price has been trading within the bands, indicating a period of consolidation.
- Bollinger %B: The %B value has been fluctuating around the midline, reflecting a balanced market sentiment.
Volume Analysis:
- On-Balance Volume (OBV): The OBV has shown mixed signals with fluctuations in volume, suggesting uncertainty among market participants.
- Chaikin Money Flow (CMF): The CMF has been positive but relatively low, indicating some buying pressure but not significant.
Conclusion:
Based on the analysis of the technical indicators, the stock is currently in a consolidation phase with mixed signals across different aspects. The moving averages suggest a bullish bias, while the MACD indicates a bearish momentum. The momentum oscillators show conflicting signals, with the RSI and Williams %R pointing towards indecisiveness in the market.
Considering the volatility and volume indicators, there is a lack of clear direction, further supporting the view of a sideways movement. Therefore, the next few days may see the stock price trading within a range without a decisive trend.
In conclusion, the stock is likely to experience sideways movement in the near term, with limited upside or downside potential until a clear trend emerges. It is advisable for investors to closely monitor key levels and wait for a clearer signal before making significant trading decisions.