Technical Analysis of CHIQ 2024-05-10
Overview:
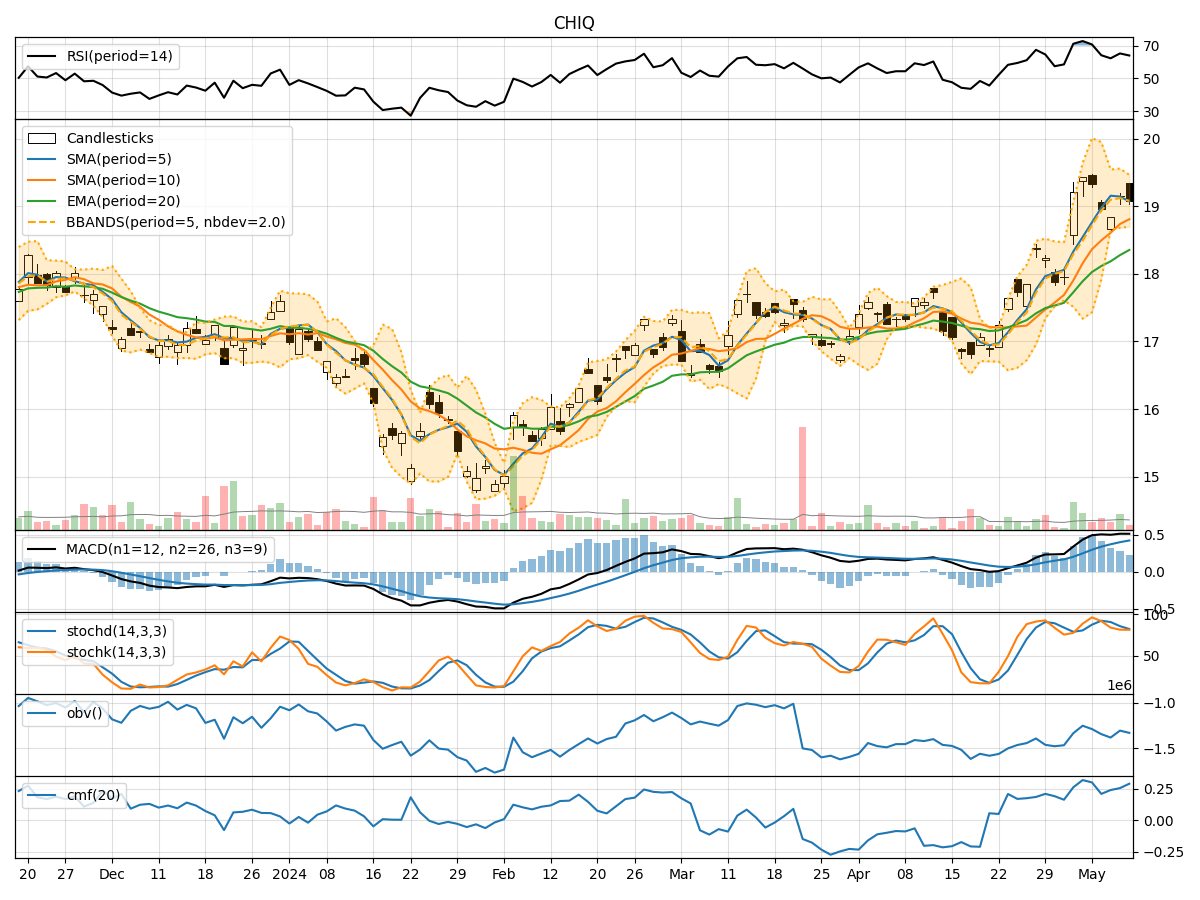
In analyzing the technical indicators for CHIQ over the last 5 days, we will delve into the trend, momentum, volatility, and volume indicators to provide a comprehensive outlook on the possible stock price movement. By examining these key aspects, we aim to offer valuable insights and predictions for the upcoming days.
Trend Analysis:
- Moving Averages (MA): The 5-day Moving Average (MA) has been consistently above the Simple Moving Average (SMA) and Exponential Moving Average (EMA), indicating a bullish trend.
- MACD: The MACD line has been above the signal line, with both lines showing an upward trend, suggesting bullish momentum.
Momentum Analysis:
- RSI: The Relative Strength Index (RSI) has been fluctuating around the 60-70 range, indicating a neutral to slightly bullish momentum.
- Stochastic Oscillator: Both %K and %D have been in the overbought zone, suggesting a potential reversal or consolidation.
Volatility Analysis:
- Bollinger Bands (BB): The stock price has been trading within the Bollinger Bands, with the bands narrowing, indicating decreasing volatility.
Volume Analysis:
- On-Balance Volume (OBV): The OBV has shown mixed movements, indicating indecision among investors.
- Chaikin Money Flow (CMF): The CMF has been positive, suggesting buying pressure in the market.
Key Observations:
- The trend indicators suggest a bullish sentiment in the short term.
- Momentum indicators show a neutral to slightly bullish stance.
- Volatility has been decreasing, indicating a possible period of consolidation.
- Volume indicators reflect mixed signals, with some buying pressure evident.
Conclusion:
Based on the analysis of the technical indicators, the next few days for CHIQ are likely to see sideways movement with a slight bullish bias. Traders should watch for potential reversals as the stochastic oscillator indicates overbought conditions. It is advisable to monitor the RSI for any signs of divergence and the OBV for confirmation of buying pressure. Overall, the stock is expected to consolidate within a narrow range before potentially resuming its upward trajectory.