Technical Analysis of CLDL 2024-05-10
Overview:
In analyzing the technical indicators for CLDL over the last 5 days, we will delve into the trend, momentum, volatility, and volume indicators to provide a comprehensive outlook on the possible stock price movement in the coming days.
Trend Analysis:
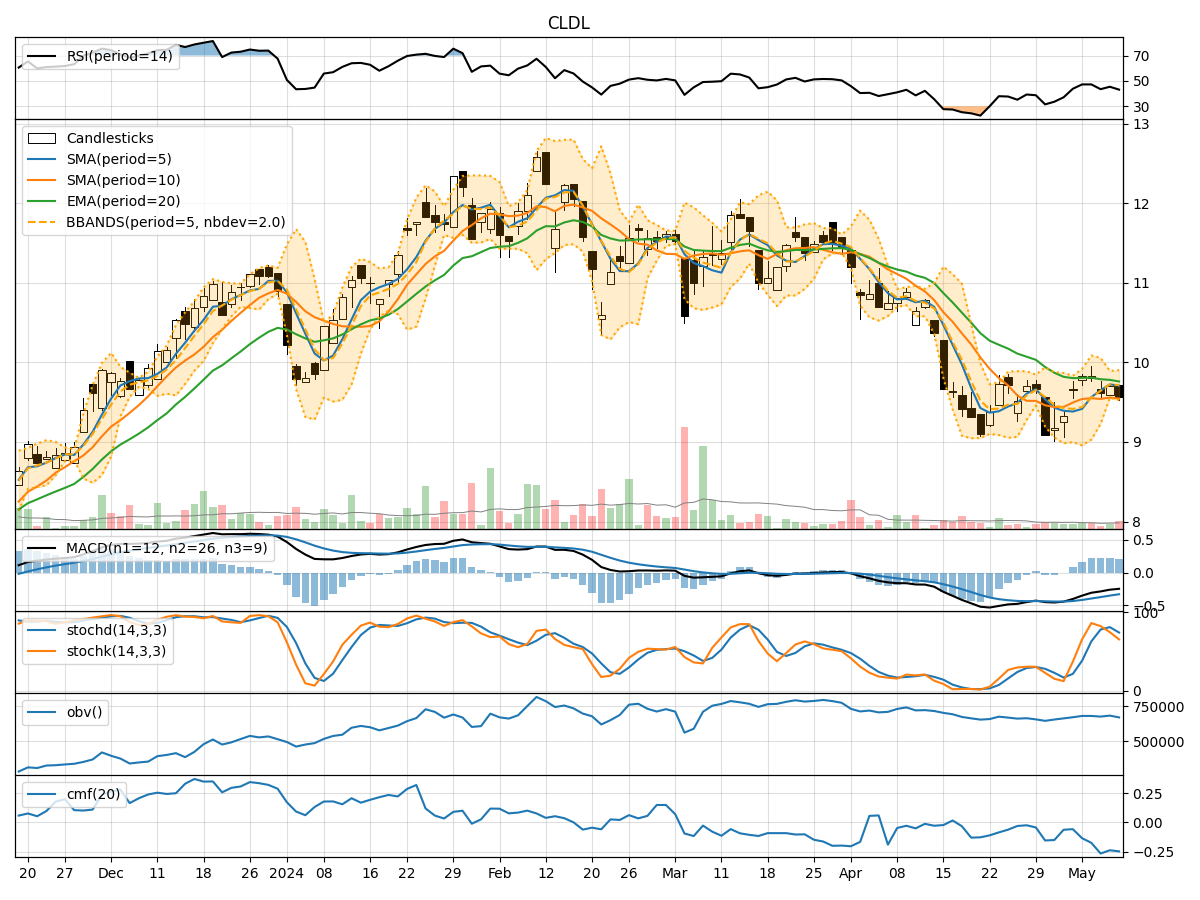
- Moving Averages (MA): The 5-day Moving Average (MA) has been fluctuating around the closing prices, indicating short-term price trends. The Simple Moving Average (SMA) and Exponential Moving Average (EMA) show a slight downtrend.
- MACD: The Moving Average Convergence Divergence (MACD) has been negative, suggesting a bearish momentum in the stock price.
Momentum Analysis:
- RSI: The Relative Strength Index (RSI) has been hovering around the neutral zone, indicating a lack of strong momentum in either direction.
- Stochastic Oscillator: Both %K and %D have been fluctuating, showing indecision in the market sentiment.
Volatility Analysis:
- Bollinger Bands (BB): The Bollinger Bands have been narrowing, indicating decreasing volatility in the stock price.
Volume Analysis:
- On-Balance Volume (OBV): The OBV has shown mixed signals, with some days seeing selling pressure and others showing accumulation.
- Chaikin Money Flow (CMF): The CMF has been negative, indicating a bearish money flow in the stock.
Key Observations:
- The stock is currently in a consolidation phase with mixed signals from various indicators.
- The lack of strong trends in moving averages and momentum indicators suggests a sideways movement.
- Volatility has been decreasing, indicating a potential period of stability in the stock price.
- Volume indicators show conflicting signals, reflecting uncertainty among market participants.
Conclusion:
Based on the analysis of the technical indicators, the next few days for CLDL are likely to see sideways movement with limited volatility. The lack of clear trends in moving averages and momentum indicators, coupled with conflicting signals from volume indicators, suggests a period of consolidation for the stock. Traders may expect the stock price to remain range-bound in the near term. It is advisable to closely monitor key support and resistance levels for potential breakout opportunities.