Technical Analysis of CLIX 2024-05-10
Overview:
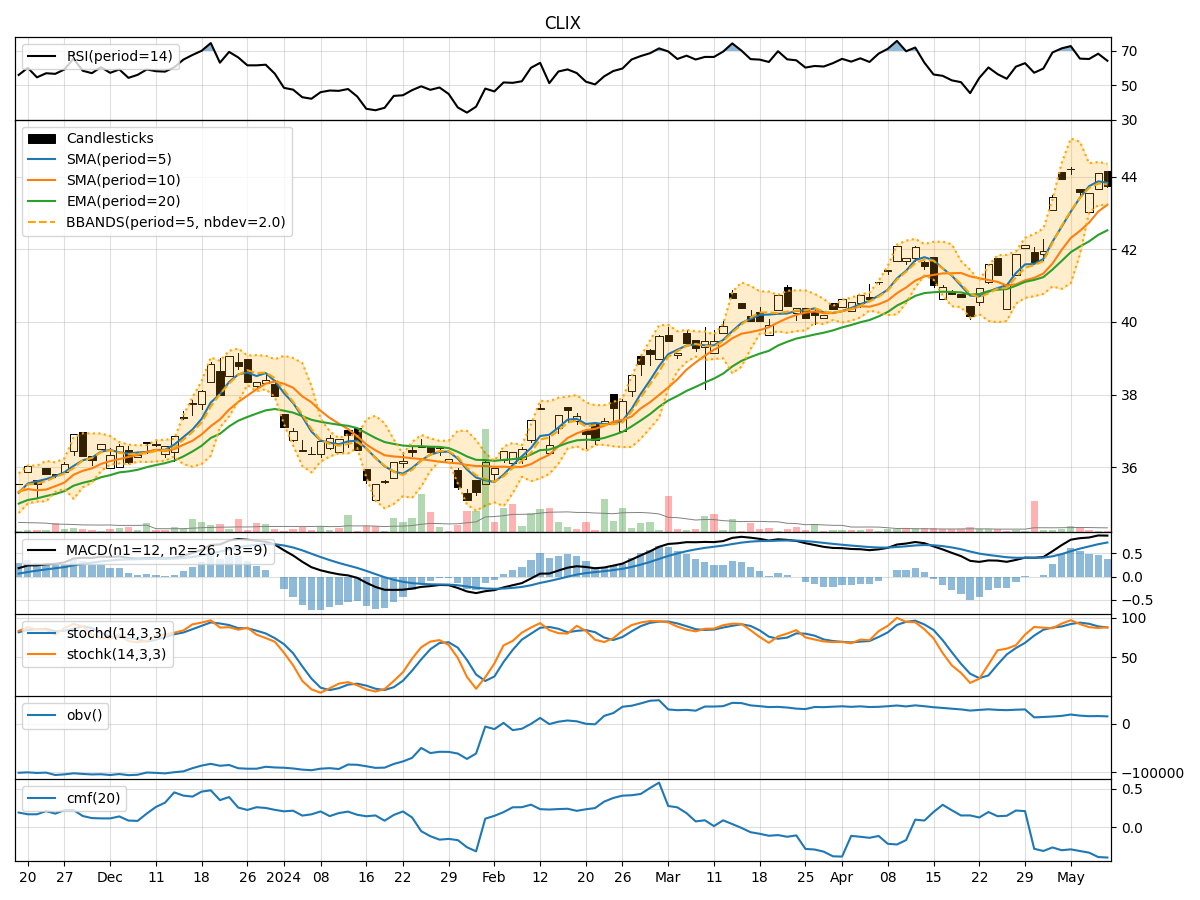
In analyzing the technical indicators for CLIX over the last 5 days, we will delve into the trend, momentum, volatility, and volume indicators to provide a comprehensive outlook on the possible stock price movement. By examining these key factors, we aim to offer valuable insights and predictions for the upcoming days.
Trend Analysis:
- Moving Averages (MA): The 5-day Moving Average (MA) has been consistently above the Simple Moving Average (SMA) and Exponential Moving Average (EMA), indicating a bullish trend.
- MACD: The MACD line has been above the signal line, with both lines showing an upward trend, suggesting bullish momentum.
- Momentum: The momentum indicators reflect a positive trend, with the stock price consistently above the moving averages.
Momentum Analysis:
- RSI: The Relative Strength Index (RSI) has been fluctuating but generally staying within the neutral to overbought territory, indicating a balanced momentum.
- Stochastic Oscillator: Both %K and %D have been in the overbought zone, suggesting a potential reversal or consolidation.
- Williams %R: The Williams %R has been fluctuating in the oversold territory, indicating potential buying opportunities.
Volatility Analysis:
- Bollinger Bands (BB): The Bollinger Bands have been narrowing, indicating decreasing volatility and a possible period of consolidation.
- Bollinger Band %B: The %B indicator has been fluctuating around the midline, suggesting a balanced market sentiment.
Volume Analysis:
- On-Balance Volume (OBV): The OBV has been relatively stable, indicating a balance between buying and selling pressure.
- Chaikin Money Flow (CMF): The CMF has been negative, suggesting a slight distribution phase.
Key Observations:
- The trend indicators suggest a bullish sentiment, supported by the MACD and moving averages.
- Momentum indicators show a mixed picture, with RSI indicating a neutral stance and stochastic oscillators hinting at potential overbought conditions.
- Volatility indicators point towards a period of consolidation, as reflected by the narrowing Bollinger Bands.
- Volume indicators indicate a balance between buying and selling pressure, with a slight negative bias in the CMF.
Conclusion:
Based on the analysis of the technical indicators, the overall outlook for CLIX in the next few days is likely to be sideways with a slight bullish bias. While the trend remains positive, the mixed momentum signals and narrowing volatility suggest a potential period of consolidation. Traders may consider monitoring key support and resistance levels for potential entry and exit points, while also keeping an eye on any significant developments in the broader market that could impact CLIX's price movement.