Technical Analysis of CLOD 2024-05-10
Overview:
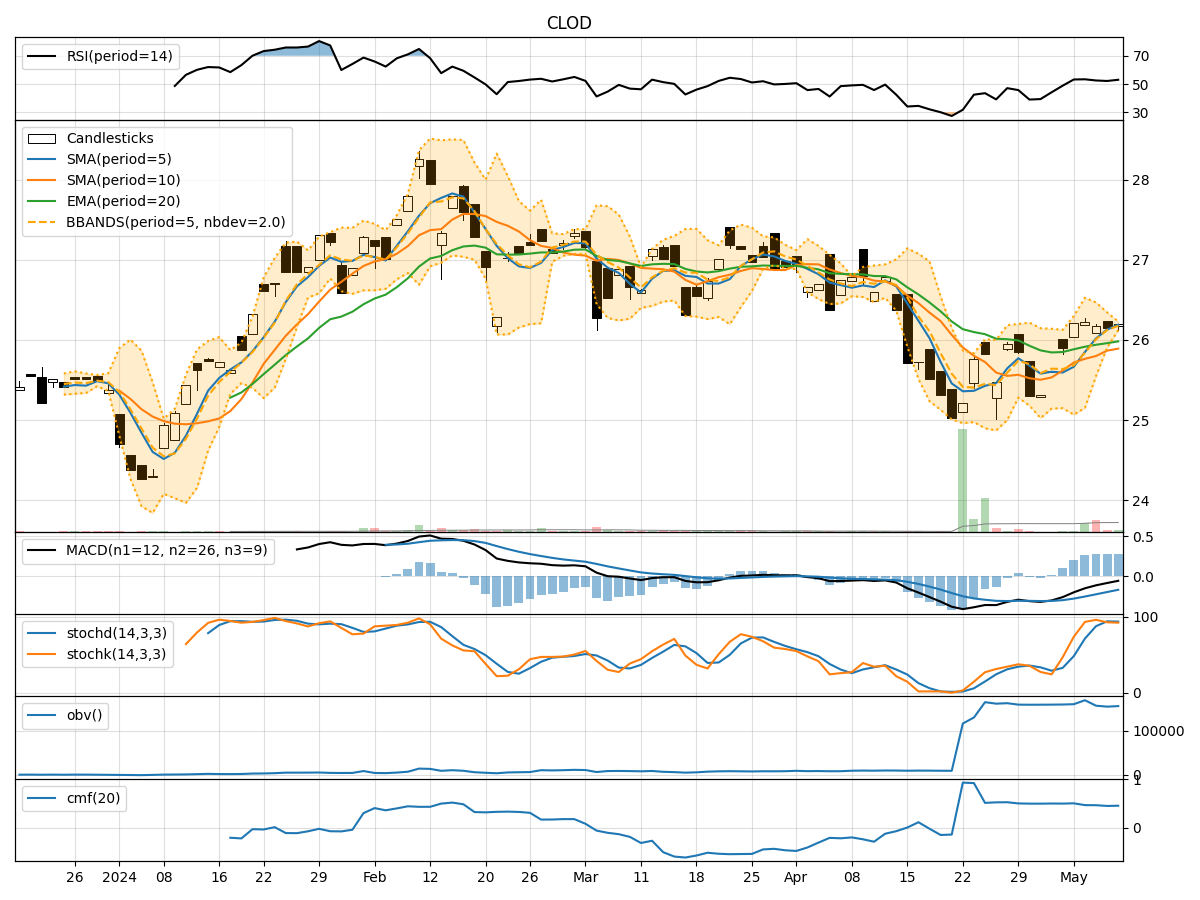
In analyzing the technical indicators for CLOD stock over the last 5 days, we will delve into the trend, momentum, volatility, and volume indicators to provide a comprehensive outlook on the possible stock price movement in the coming days. By examining key metrics such as moving averages, MACD, RSI, Bollinger Bands, and OBV, we aim to offer valuable insights and predictions for potential price trends.
Trend Analysis:
- Moving Averages (MA): The 5-day moving average has been consistently above the simple moving average (SMA) and exponential moving average (EMA), indicating a short-term uptrend.
- MACD: The MACD line has been negative but trending towards the signal line, suggesting a potential bullish crossover.
- MACD Histogram: The histogram has been increasing, indicating strengthening bullish momentum.
Momentum Analysis:
- RSI: The RSI has been fluctuating around the 50 level, indicating a neutral momentum.
- Stochastic Oscillator: Both %K and %D have been in the overbought zone, suggesting a potential reversal.
- Williams %R: The indicator has been hovering in the oversold territory, signaling a possible buying opportunity.
Volatility Analysis:
- Bollinger Bands: The stock price has been trading within the bands, with the bands narrowing, indicating decreasing volatility.
- Bollinger %B: The %B indicator has been fluctuating around 0.5, suggesting a balanced market sentiment.
Volume Analysis:
- On-Balance Volume (OBV): The OBV has been relatively stable, indicating consistent buying pressure.
- Chaikin Money Flow (CMF): The CMF has been positive, reflecting accumulation by investors.
Key Observations:
- The trend indicators suggest a potential bullish crossover in the short term.
- Momentum indicators show mixed signals, with RSI indicating neutrality and stochastic oscillators hinting at a possible reversal.
- Volatility has been decreasing, indicating a period of consolidation.
- Volume indicators point towards consistent buying pressure and accumulation by investors.
Conclusion:
Based on the analysis of technical indicators, the stock is likely to experience a period of consolidation in the coming days. While the trend indicators suggest a bullish bias, the mixed signals from momentum indicators and decreasing volatility indicate a lack of strong directional momentum. Investors should monitor key levels such as the moving averages and MACD crossover for potential entry or exit points. Overall, a sideways movement or slight upward bias is anticipated in the near term.