Technical Analysis of CLOI 2024-05-10
Overview:
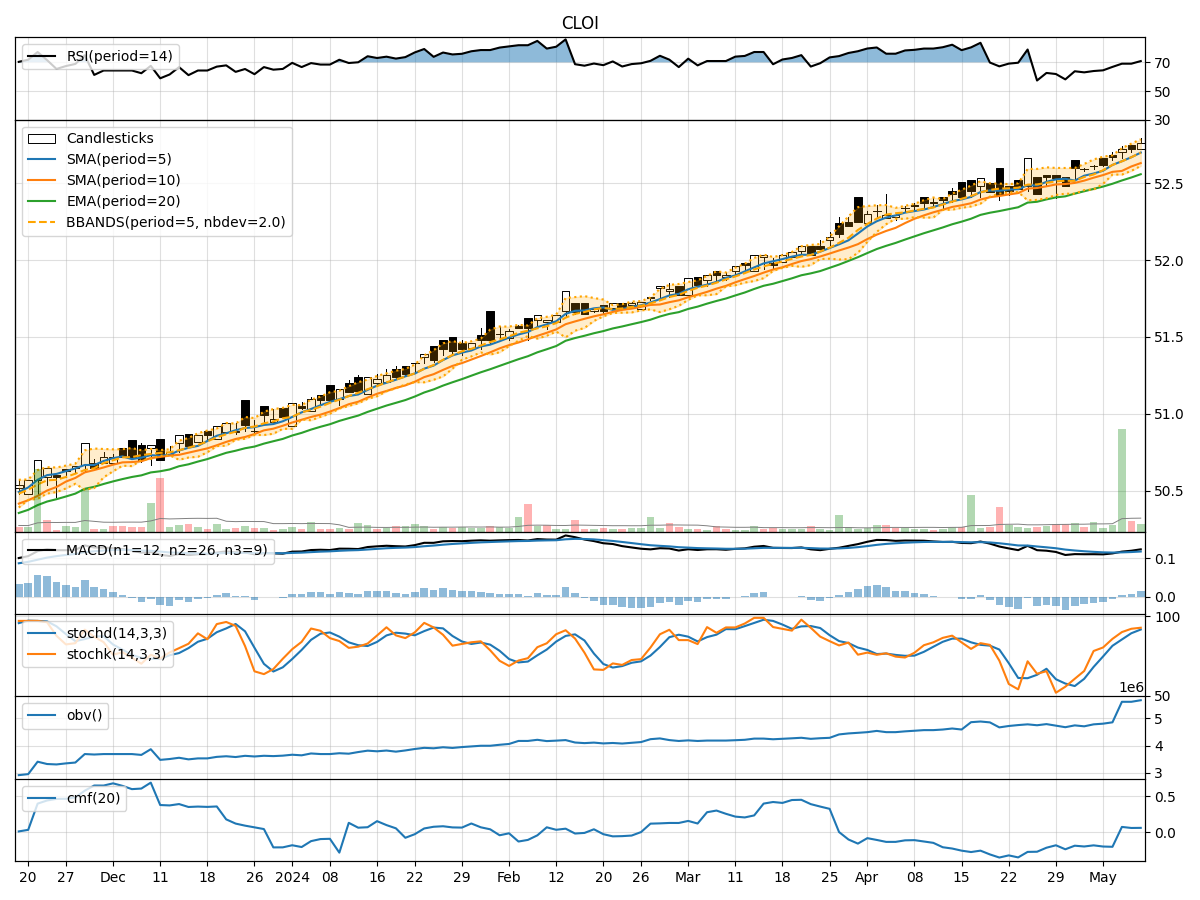
In analyzing the technical indicators for CLOI over the last 5 days, we will delve into the trend, momentum, volatility, and volume indicators to provide a comprehensive outlook on the possible stock price movement in the coming days.
Trend Analysis:
- Moving Averages (MA): The 5-day Moving Average (MA) has been steadily increasing, indicating a positive trend in the stock price.
- MACD: The MACD line has been consistently above the signal line, suggesting bullish momentum.
- EMA: The Exponential Moving Average (EMA) has been on an upward trajectory, supporting the bullish sentiment.
Momentum Analysis:
- RSI: The Relative Strength Index (RSI) has been in the overbought territory, indicating strong buying momentum.
- Stochastic Oscillator: Both %K and %D have been in the overbought zone, signaling a potential reversal.
- Williams %R: The Williams %R is in the oversold region, suggesting a possible price reversal.
Volatility Analysis:
- Bollinger Bands (BB): The stock price has been trading within the upper Bollinger Band, indicating high volatility.
- BB Width: The Bollinger Band width has been expanding, suggesting increased price fluctuations.
- BB %B: The %B indicator has been fluctuating around the upper band, indicating potential overbought conditions.
Volume Analysis:
- On-Balance Volume (OBV): The OBV has been increasing, reflecting strong buying pressure.
- Chaikin Money Flow (CMF): The CMF has been positive, indicating money flow into the stock.
Key Observations:
- The trend indicators suggest a bullish sentiment with moving averages and MACD supporting an upward trend.
- Momentum indicators show mixed signals with RSI in overbought territory and stochastic oscillators hinting at a potential reversal.
- Volatility indicators point towards high price fluctuations and potential overbought conditions.
- Volume indicators reflect strong buying pressure and positive money flow into the stock.
Conclusion:
Based on the analysis of technical indicators, the stock price of CLOI is likely to experience further upward movement in the coming days. The bullish trend supported by moving averages and MACD, coupled with strong buying pressure indicated by volume indicators, suggests a positive outlook. However, caution is advised as momentum indicators show signs of potential reversal, and high volatility may lead to price fluctuations. Traders should closely monitor key levels and consider implementing risk management strategies to navigate the market dynamics effectively.