Technical Analysis of CLSE 2024-05-10
Overview:
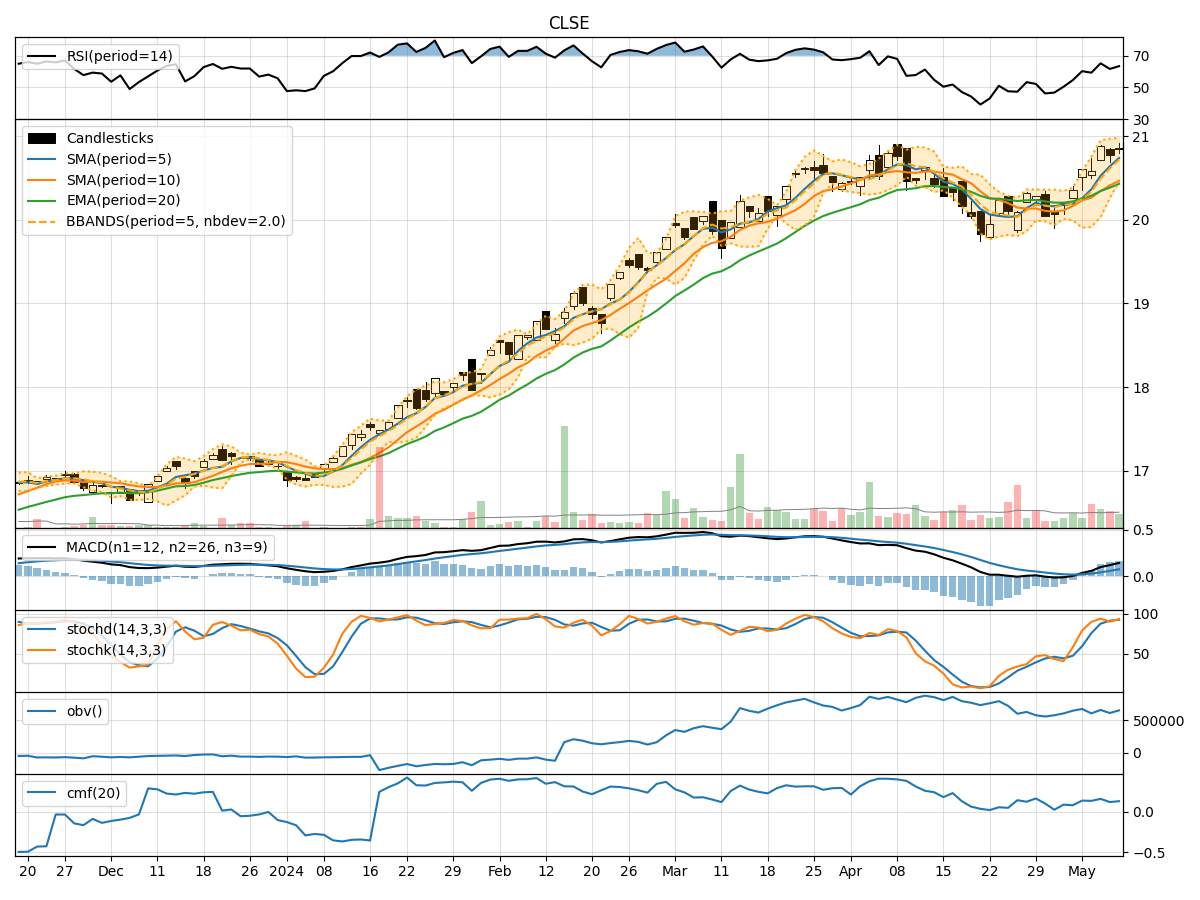
In the last 5 trading days, the stock price of CLSE has shown a relatively stable trend with minor fluctuations. Various technical indicators provide insights into the stock's trend, momentum, volatility, and volume dynamics. By analyzing these indicators, we can derive potential future price movements for CLSE.
Trend Analysis:
- Moving Averages (MA): The moving averages indicate a gradual uptrend in the stock price over the last 5 days. The 5-day MA is consistently above the 10-day SMA, suggesting a short-term bullish trend.
- MACD: The MACD line has been increasing, indicating a strengthening bullish momentum in the stock price.
- RSI: The RSI values are within the neutral range, indicating neither overbought nor oversold conditions.
Momentum Analysis:
- Stochastic Oscillator: Both %K and %D values are in the overbought zone, suggesting a potential reversal or consolidation in the stock price.
- Williams %R: The Williams %R is negative, indicating a bearish sentiment in the market.
Volatility Analysis:
- Bollinger Bands (BB): The Bollinger Bands are narrowing, indicating decreasing volatility in the stock price.
- BB %B: The %B value is relatively low, suggesting the stock is trading closer to the lower band.
Volume Analysis:
- On-Balance Volume (OBV): The OBV has shown mixed movements, indicating indecision among investors.
- Chaikin Money Flow (CMF): The CMF is positive but relatively low, indicating some buying pressure in the stock.
Key Observations:
- The trend indicators suggest a bullish sentiment in the short term.
- Momentum indicators show signs of potential overbought conditions, hinting at a possible reversal.
- Volatility is decreasing, indicating a period of consolidation or sideways movement.
- Volume indicators reflect mixed investor sentiment with some buying pressure.
Conclusion:
Based on the analysis of technical indicators, the next few days for CLSE stock price could see sideways movement or consolidation. The bullish trend may continue in the short term, but the overbought conditions and decreasing volatility suggest a potential slowdown in price movement. Investors should closely monitor key support and resistance levels for potential entry or exit points.
Recommendation:
- Short-term Traders: Consider taking profits or tightening stop-loss levels due to potential overbought conditions.
- Long-term Investors: Monitor the stock closely for a potential entry point during consolidation phases.
- Risk Management: Implement proper risk management strategies to protect capital in case of unexpected price movements.
Always remember to conduct thorough research and consider multiple factors before making any investment decisions.