Technical Analysis of CMCI 2024-05-10
Overview:
In analyzing the provided CMCI TA data for the last 5 days, we will delve into the technical indicators across trend, momentum, volatility, and volume to derive insights into the possible future stock price movement. By examining key metrics and patterns, we aim to provide a comprehensive outlook on the stock's potential trajectory.
Trend Analysis:
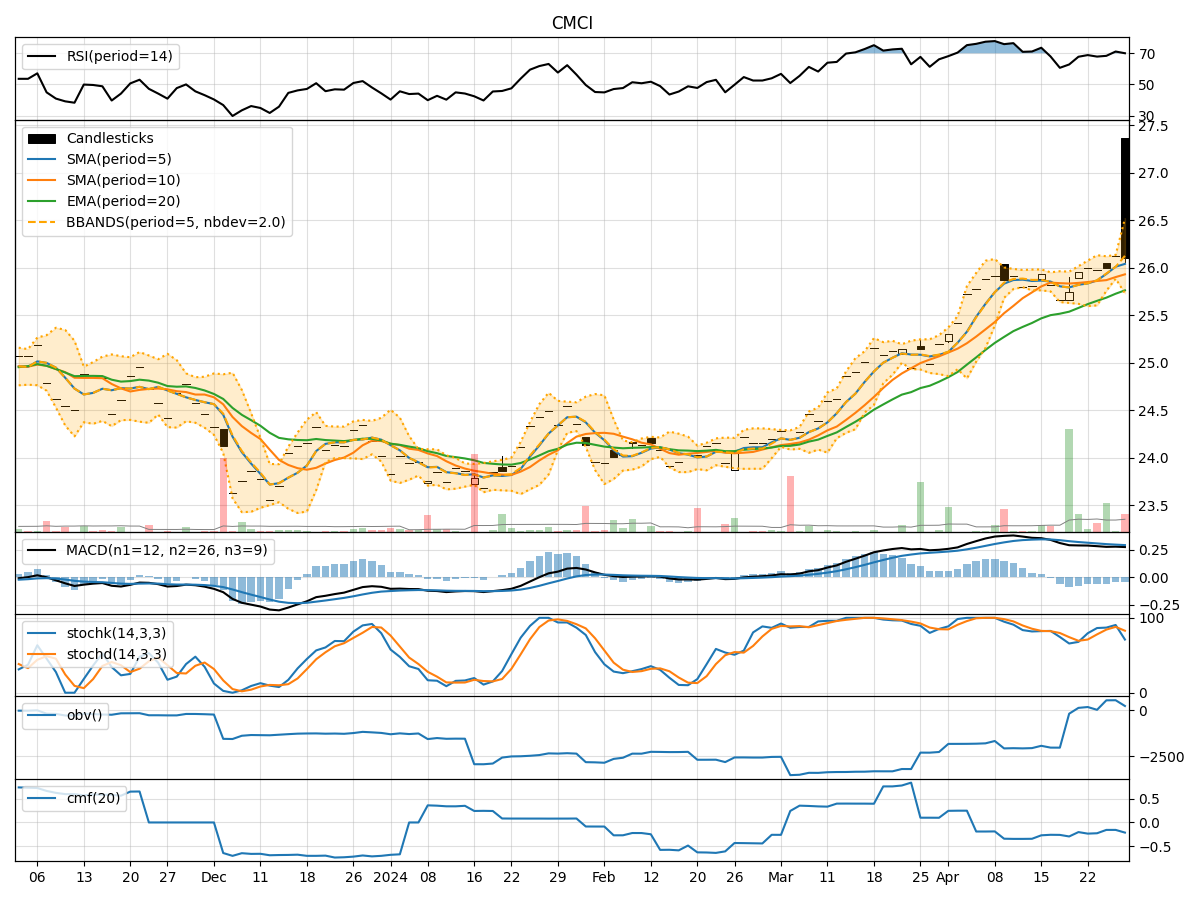
- Moving Averages (MA): The 5-day MA has been trending slightly above the Simple Moving Average (SMA) and Exponential Moving Average (EMA), indicating a short-term upward trend.
- MACD: The MACD line has been consistently positive, suggesting bullish momentum in the stock price.
- MACD Histogram: The MACD Histogram has been decreasing but remains above the signal line, indicating a potential slowdown in the bullish momentum.
Momentum Analysis:
- RSI: The Relative Strength Index (RSI) has been hovering around the mid-level, indicating a neutral momentum in the stock.
- Stochastic Oscillator: Both %K and %D have been fluctuating in the overbought territory, suggesting a potential reversal in the stock price.
- Williams %R: The Williams %R is in the oversold region, indicating a possible buying opportunity.
Volatility Analysis:
- Bollinger Bands (BB): The stock price has been trading within the Bollinger Bands, with the bands narrowing, suggesting a period of consolidation.
- Bollinger %B: The %B indicator is below 1, indicating the stock price is trading below the lower band, potentially oversold.
- Bollinger Band Width: The Band Width has been decreasing, signaling a decrease in volatility.
Volume Analysis:
- On-Balance Volume (OBV): The OBV has been relatively flat, indicating a balance between buying and selling pressure.
- Chaikin Money Flow (CMF): The CMF has been negative, suggesting outflow of money from the stock.
Conclusion:
Based on the analysis of the technical indicators: - Trend: The stock is in an upward trend supported by the MA and MACD. - Momentum: Momentum is neutral to slightly bearish based on RSI and Stochastic Oscillator. - Volatility: The stock is currently in a consolidation phase as indicated by the Bollinger Bands. - Volume: The volume indicators suggest a balance between buying and selling pressure.
Future Price Movement:
Considering the overall analysis, the stock is likely to experience sideways movement in the next few days with a potential for a slight pullback due to the neutral to slightly bearish momentum indicators. Traders may consider waiting for a clearer trend confirmation before making significant trading decisions.