Technical Analysis of CMDT 2024-05-10
Overview:
In analyzing the technical indicators for CMDT stock over the last 5 days, we will delve into the trend, momentum, volatility, and volume indicators to provide a comprehensive outlook on the possible stock price movement in the coming days. By examining these key aspects, we aim to offer valuable insights and recommendations for potential investors.
Trend Indicators:
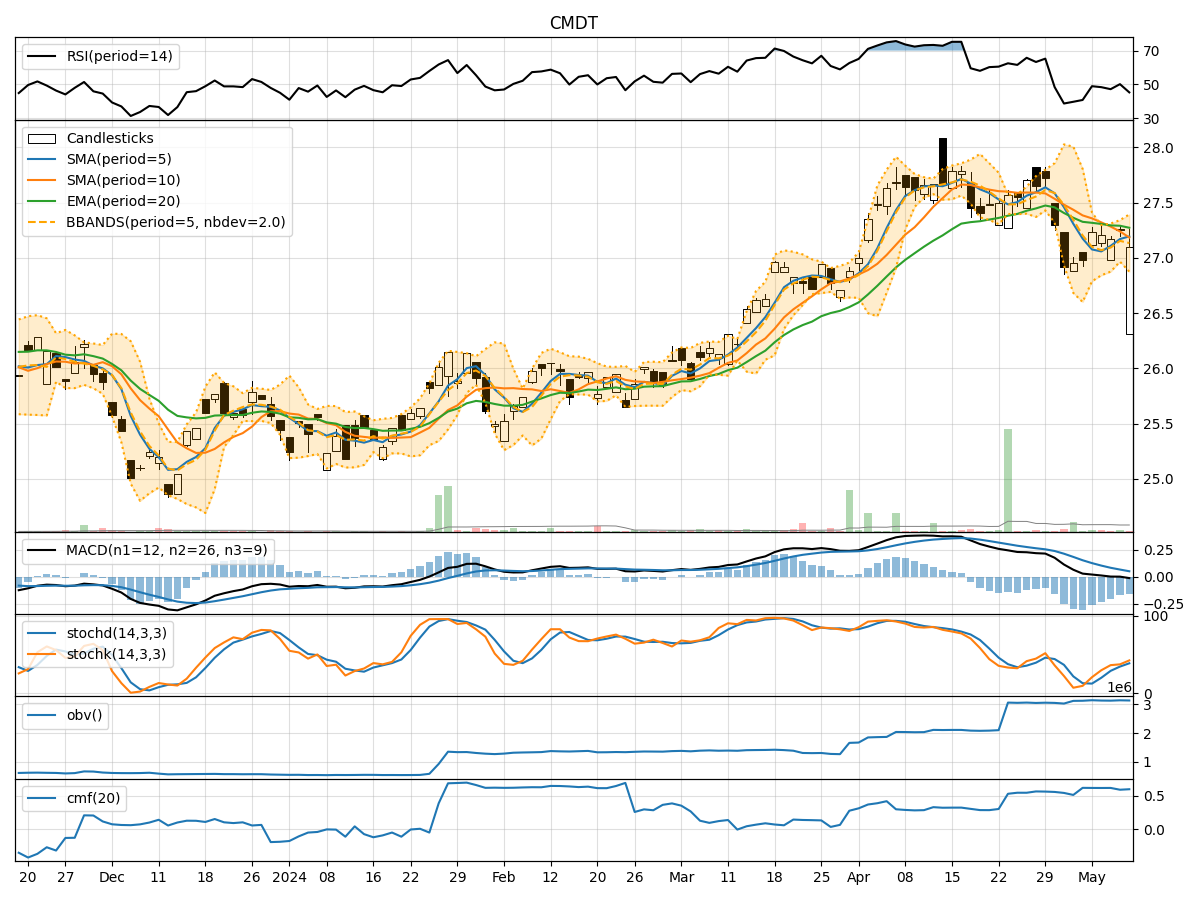
- Moving Averages (MA): The 5-day MA has been fluctuating around the closing prices, indicating short-term price trends. The SMA(10) and EMA(20) have shown a slight decline, suggesting a weakening trend.
- MACD: The MACD line has been negative, indicating a bearish trend. The MACD Histogram has also been decreasing, signaling a potential bearish momentum.
- Conclusion: The trend indicators point towards a bearish outlook for the stock.
Momentum Indicators:
- RSI: The RSI has been hovering around the neutral zone, indicating a lack of strong momentum in either direction.
- Stochastic Oscillator: Both %K and %D have been relatively low, suggesting a lack of strong buying or selling pressure.
- Conclusion: The momentum indicators reflect a neutral stance with no clear direction.
Volatility Indicators:
- Bollinger Bands: The stock price has been trading within the bands, indicating moderate volatility. The bands have not shown significant expansion or contraction.
- Conclusion: Volatility remains stable with no extreme movements expected.
Volume Indicators:
- On-Balance Volume (OBV): The OBV has shown slight fluctuations, indicating mixed buying and selling pressure.
- Chaikin Money Flow (CMF): The CMF has been relatively stable, suggesting a balance between buying and selling pressure over the past 20 days.
- Conclusion: Volume indicators suggest a neutral sentiment with no clear dominance of buyers or sellers.
Overall Conclusion:
Based on the analysis of the technical indicators, the stock is likely to experience a bearish trend in the coming days, supported by the negative MACD and declining moving averages. The momentum indicators indicate a lack of strong directional bias, while volatility and volume indicators suggest a relatively stable market environment. Investors should exercise caution and consider waiting for clearer signals before making any significant trading decisions.
Key Takeaways:
- Trend: Bearish
- Momentum: Neutral
- Volatility: Stable
- Volume: Neutral
Recommendation:
Given the overall bearish trend and mixed signals from momentum, volume, and volatility indicators, it is advisable for investors to adopt a cautious approach and wait for more definitive signals before taking any significant positions in CMDT stock. Monitoring the price action closely and reassessing the technical indicators over the next few days will be crucial in making informed investment decisions.