Technical Analysis of CMF 2024-05-10
Overview:
In analyzing the provided Technical Analysis (TA) data for the last 5 days, we will delve into the trend, momentum, volatility, and volume indicators to forecast the possible stock price movement for the next few days. By examining these key indicators, we aim to provide a comprehensive and insightful analysis to guide your decision-making process.
Trend Indicators:
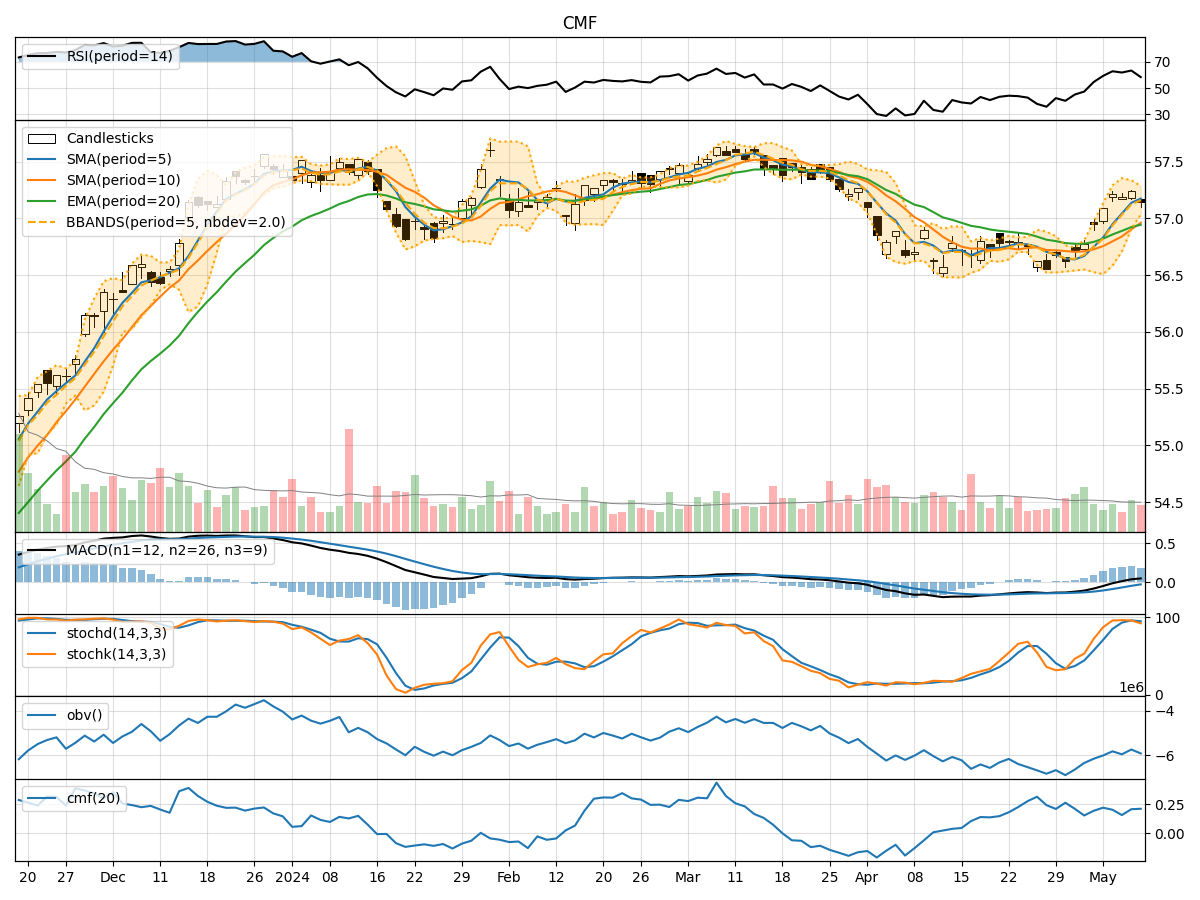
- Moving Averages (MA): The 5-day MA has been consistently above the 10-day SMA, indicating a short-term bullish trend. The EMA(20) has been steadily increasing, reflecting positive momentum.
- MACD: The MACD line has been above the signal line for the past 5 days, suggesting bullish momentum.
- Conclusion: The trend indicators signal a bullish outlook for the stock price.
Momentum Indicators:
- RSI: The RSI has been fluctuating but generally staying in the overbought territory, indicating strong buying pressure.
- Stochastic Oscillator: Both %K and %D have been high, suggesting an overbought condition.
- Conclusion: Momentum indicators point towards a bullish sentiment in the market.
Volatility Indicators:
- Bollinger Bands (BB): The stock price has been trading within the upper Bollinger Band, indicating increased volatility.
- Conclusion: Volatility indicators suggest a volatile trading environment.
Volume Indicators:
- On-Balance Volume (OBV): The OBV has been fluctuating, indicating mixed buying and selling pressure.
- Chaikin Money Flow (CMF): The CMF(20) has been positive, indicating buying pressure.
- Conclusion: Volume indicators show a mixed sentiment in the market.
Key Observations and Opinions:
- The trend and momentum indicators align in signaling a bullish outlook for the stock price.
- Volatility indicators suggest a volatile trading environment, which could lead to rapid price movements.
- Volume indicators show a mixed sentiment, indicating uncertainty in market participation.
Conclusion:
Based on the analysis of the technical indicators, the next few days are likely to see the stock price continue its bullish trend, supported by positive momentum and trend indicators. However, the volatile trading environment and mixed volume indicators suggest the need for caution. Traders and investors should closely monitor price movements and consider risk management strategies to navigate potential market fluctuations.