Technical Analysis of CNRG 2024-05-10
Overview:
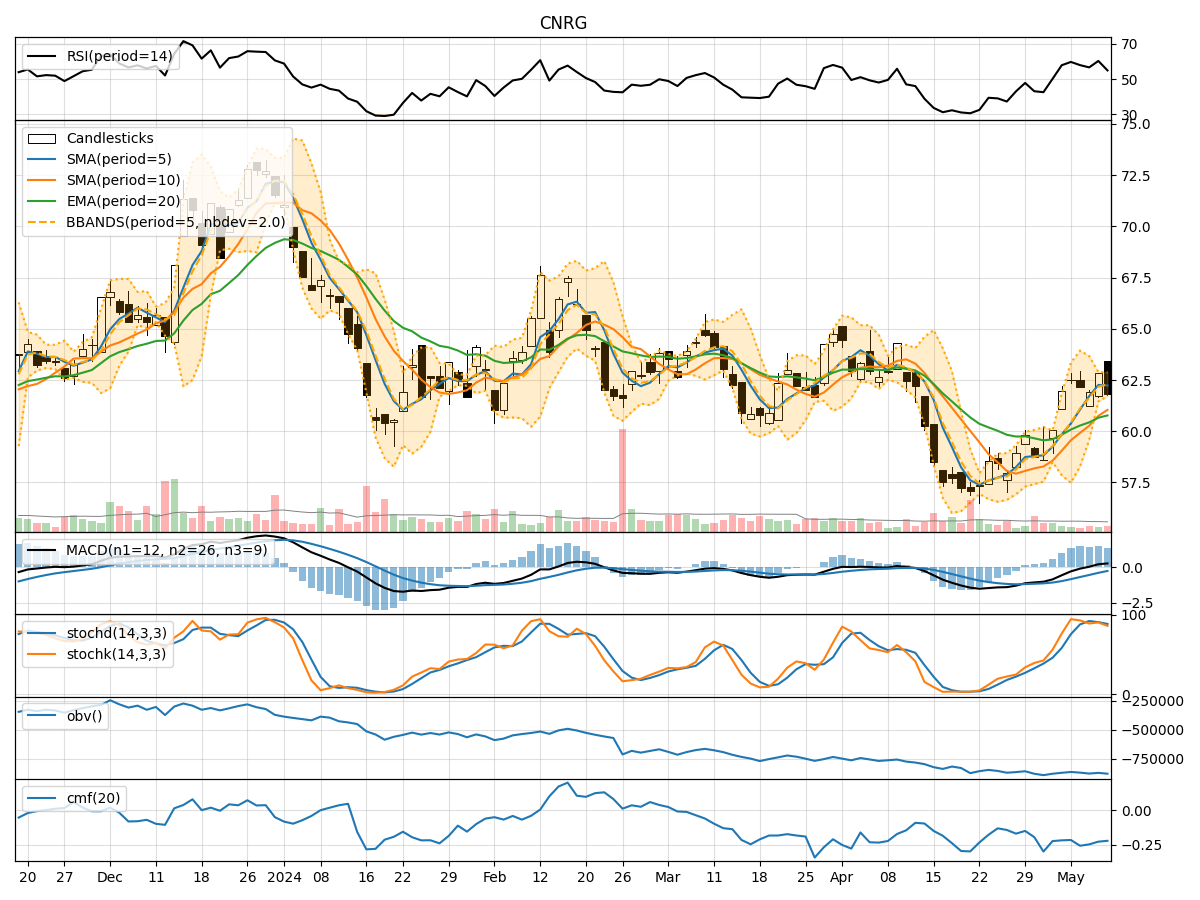
In analyzing the technical indicators for CNRG over the last 5 days, we will delve into the trend, momentum, volatility, and volume indicators to provide a comprehensive outlook on the possible stock price movement in the coming days.
Trend Analysis:
- Moving Averages (MA): The 5-day Moving Average has been consistently above the Simple Moving Average (SMA) and Exponential Moving Average (EMA), indicating a bullish trend.
- MACD: The MACD line has been consistently above the signal line, suggesting a bullish momentum.
- RSI: The Relative Strength Index (RSI) has been fluctuating but generally staying within the neutral to overbought territory.
Momentum Analysis:
- Stochastic Oscillator: The Stochastic Oscillator has been showing overbought conditions, indicating a potential reversal in the short term.
- Williams %R: The Williams %R is in oversold territory, suggesting a possible bullish reversal.
Volatility Analysis:
- Bollinger Bands: The stock price has been trading within the Bollinger Bands, indicating normal volatility levels.
- Bollinger %B: The %B indicator has been fluctuating around the midline, suggesting a balanced market sentiment.
Volume Analysis:
- On-Balance Volume (OBV): The OBV has been showing a slight decrease, indicating some distribution happening in the stock.
- Chaikin Money Flow (CMF): The CMF has been negative, suggesting a bearish money flow trend.
Conclusion:
Based on the analysis of the technical indicators: - Trend: The trend indicators suggest a bullish outlook for the stock. - Momentum: The momentum indicators show conflicting signals with the Stochastic Oscillator indicating a potential reversal while the Williams %R suggests a bullish reversal. - Volatility: The volatility indicators point towards a sideways movement with normal volatility levels. - Volume: The volume indicators indicate a bearish money flow trend.
Overall Assessment:
Considering the mixed signals from the momentum indicators and the bearish money flow trend in volume, there might be some short-term volatility and consolidation in the stock price. However, the overall bullish trend indicated by the moving averages and MACD suggests a potential upward movement in the coming days. Traders should closely monitor the Stochastic Oscillator for a possible reversal confirmation and keep an eye on volume trends for any shifts in market sentiment.