Technical Analysis of CNXT 2024-05-10
Overview:
In analyzing the technical indicators for CNXT over the last 5 days, we will delve into the trend, momentum, volatility, and volume indicators to provide a comprehensive outlook on the possible stock price movement in the coming days. By examining these key aspects, we aim to offer valuable insights and predictions for informed decision-making.
Trend Analysis:
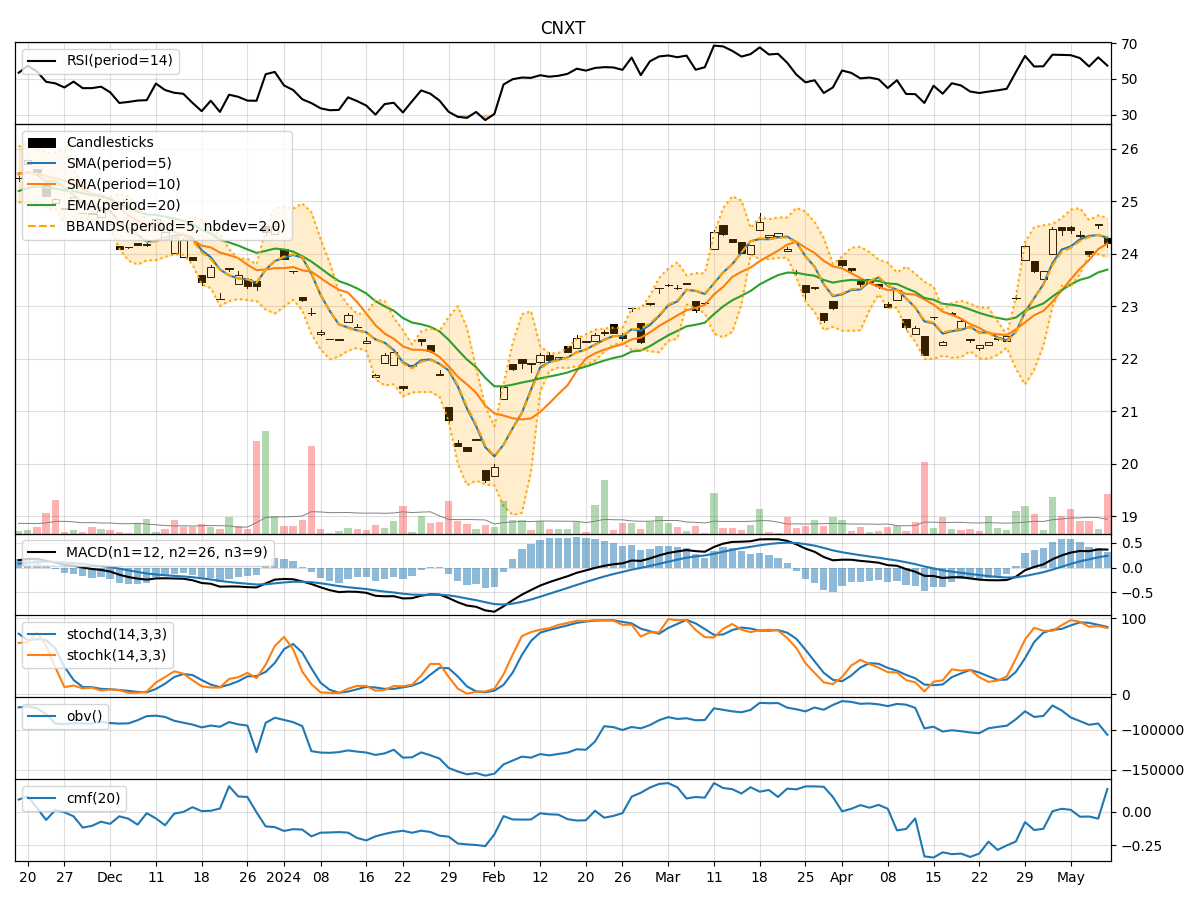
- Moving Averages (MA): The 5-day Moving Average (MA) has been consistently above the Simple Moving Average (SMA) and Exponential Moving Average (EMA), indicating a bullish trend.
- MACD: The MACD line has been above the signal line, with both lines showing an upward trend, suggesting positive momentum.
- MACD Histogram: The MACD Histogram has been increasing, indicating strengthening bullish momentum.
Momentum Analysis:
- RSI: The Relative Strength Index (RSI) has been fluctuating around the 50 level, indicating a neutral momentum.
- Stochastic Oscillator: Both %K and %D have been trending downwards, suggesting a potential bearish momentum.
- Williams %R: The Williams %R is in the oversold region, indicating a possible reversal in momentum.
Volatility Analysis:
- Bollinger Bands (BB): The stock price has been trading within the Bollinger Bands, with the bands narrowing, suggesting decreasing volatility.
- Bollinger %B: The %B indicator is hovering around the middle, indicating a neutral volatility level.
Volume Analysis:
- On-Balance Volume (OBV): The OBV has been fluctuating, indicating indecision among investors regarding the stock.
- Chaikin Money Flow (CMF): The CMF has been negative, suggesting outflow of money from the stock.
Key Observations:
- The trend indicators suggest a bullish sentiment in the short term.
- Momentum indicators show a mixed signal with a slight bearish bias.
- Volatility indicators point towards decreasing volatility in the stock.
- Volume indicators reflect indecision and a slight bearish bias among investors.
Conclusion:
Based on the analysis of the technical indicators, the next few days' possible stock price movement for CNXT is likely to be sideways with a slight bearish bias. While the trend indicators signal a bullish sentiment, the momentum indicators and volume indicators suggest a potential bearish momentum and investor indecision. The decreasing volatility also supports a sideways movement in the stock price. Traders should exercise caution and closely monitor key levels for potential entry or exit points.
Recommendation:
- Short-term Traders: Consider taking profit on bullish positions and wait for a clearer signal before entering new trades.
- Long-term Investors: Monitor the stock closely for any significant developments and consider holding positions with a stop-loss in place to manage risk effectively.
By combining insights from trend, momentum, volatility, and volume indicators, traders and investors can make well-informed decisions aligned with the current market dynamics and technical signals.