Technical Analysis of CNYA 2024-05-10
Overview:
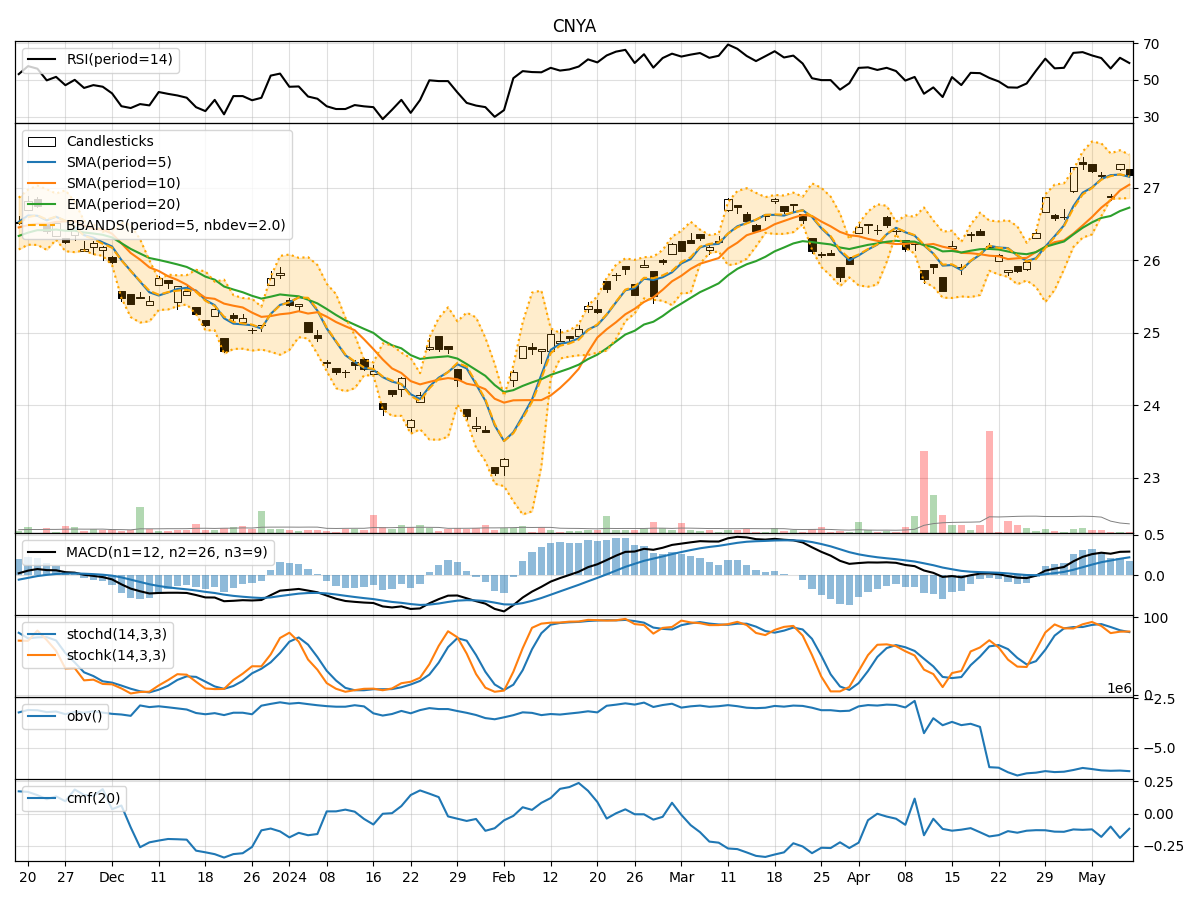
In analyzing the technical indicators for CNYA stock over the last 5 days, we will delve into the trend, momentum, volatility, and volume indicators to provide a comprehensive outlook on the possible stock price movement in the coming days. By examining these key indicators, we aim to offer valuable insights and recommendations for potential investors.
Trend Analysis:
- Moving Averages (MA): The 5-day MA has been consistently above the closing prices, indicating a short-term uptrend.
- MACD: The MACD line has been above the signal line, suggesting bullish momentum.
- RSI: The RSI values have been fluctuating around the 50 level, indicating a neutral stance.
Key Observation: The trend indicators suggest a bullish sentiment in the short term.
Momentum Analysis:
- Stochastic Oscillator: The Stochastic Oscillator values have been fluctuating but generally staying in the overbought territory.
- Williams %R (WillR): The Williams %R values have been oscillating near oversold levels.
Key Observation: Momentum indicators show mixed signals with a slight bias towards overbought conditions.
Volatility Analysis:
- Bollinger Bands (BB): The stock price has been trading within the Bollinger Bands, indicating normal volatility.
- Bollinger %B (BBP): The %B values have been fluctuating around the midline, suggesting balanced volatility.
Key Observation: Volatility indicators point towards stable price movements with no extreme fluctuations.
Volume Analysis:
- On-Balance Volume (OBV): The OBV values have been fluctuating, indicating mixed buying and selling pressure.
- Chaikin Money Flow (CMF): The CMF values have been negative, suggesting a lack of strong buying interest.
Key Observation: Volume indicators reflect a neutral stance with no clear direction in buying or selling pressure.
Conclusion:
Based on the analysis of trend, momentum, volatility, and volume indicators, the overall outlook for CNYA stock in the next few days is bullish with a positive bias. The trend indicators suggest a continuation of the short-term uptrend, while momentum indicators show a slight overbought condition. Volatility remains stable, indicating no significant price swings expected. However, the volume indicators signal a lack of strong buying interest, which could potentially limit the extent of the bullish movement.
Recommendation: Considering the overall bullish sentiment but with caution due to mixed volume signals, investors may consider buying on dips or waiting for a clearer volume confirmation before entering a long position. It is essential to monitor the price action closely and adjust the strategy accordingly to manage risks effectively.