Technical Analysis of COM 2024-05-10
Overview:
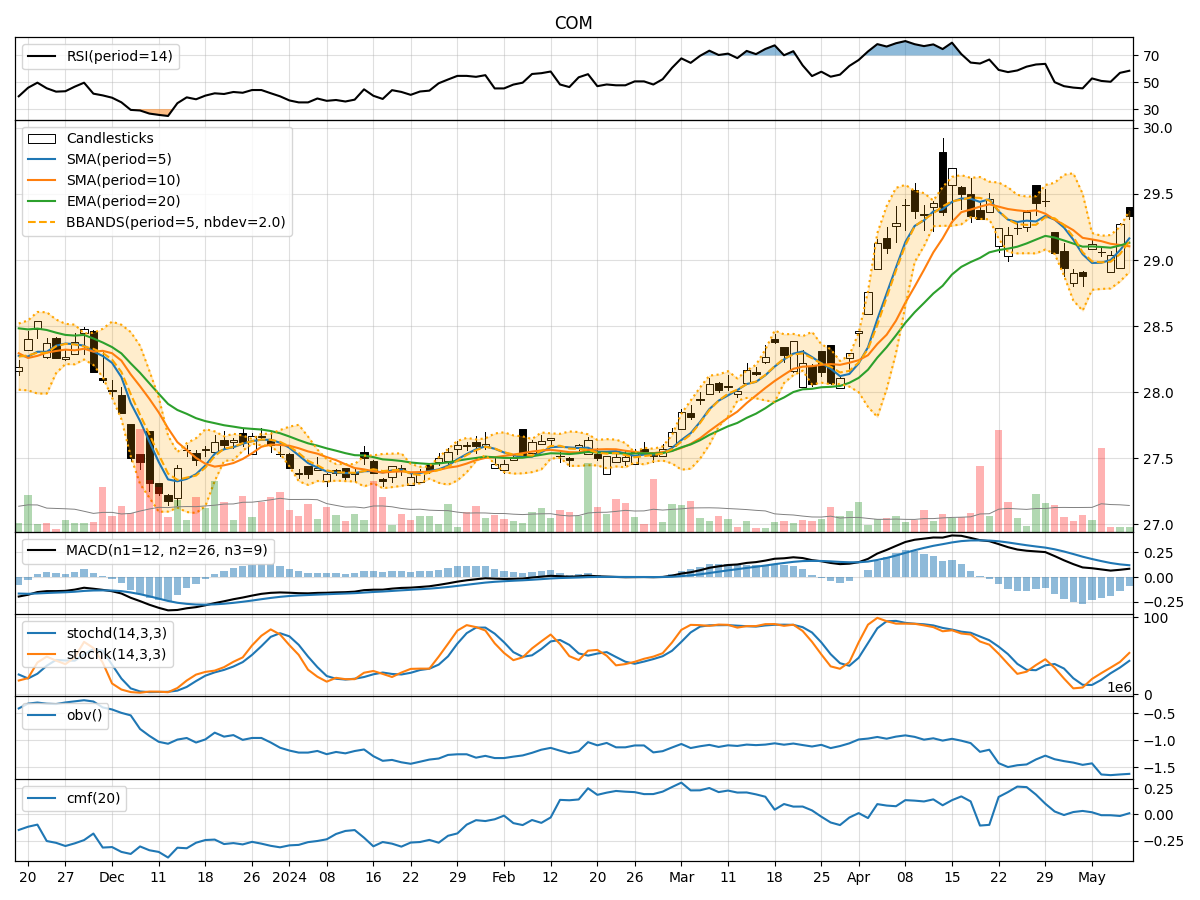
In analyzing the technical indicators for COM stock over the last 5 days, we will delve into the trend, momentum, volatility, and volume indicators to provide a comprehensive outlook on the possible stock price movement in the coming days. By examining these key indicators, we aim to offer valuable insights and predictions to guide investment decisions.
Trend Indicators:
- Moving Averages (MA): The 5-day Moving Average (MA) has been trending slightly above the Simple Moving Average (SMA) and Exponential Moving Average (EMA), indicating a short-term positive trend.
- MACD: The Moving Average Convergence Divergence (MACD) has shown positive values, with the MACD line consistently above the Signal line, suggesting bullish momentum.
- Conclusion: The trend indicators point towards an upward trend in the stock price.
Momentum Indicators:
- RSI: The Relative Strength Index (RSI) has been fluctuating around the mid-level, indicating a balanced momentum between buying and selling pressure.
- Stochastic Oscillator: Both %K and %D values have been increasing, suggesting strengthening momentum.
- Conclusion: Momentum indicators imply a neutral to slightly bullish sentiment in the stock.
Volatility Indicators:
- Bollinger Bands (BB): The stock price has been trading within the Bollinger Bands, with the bands widening slightly, indicating increased volatility.
- Conclusion: Volatility indicators suggest a slightly increased volatility in the stock price.
Volume Indicators:
- On-Balance Volume (OBV): The OBV has been fluctuating, indicating mixed buying and selling pressure.
- Chaikin Money Flow (CMF): The CMF has been negative, signaling a slight outflow of money from the stock.
- Conclusion: Volume indicators reflect a mixed sentiment in terms of buying and selling pressure.
Overall Conclusion:
Based on the analysis of trend, momentum, volatility, and volume indicators, the overall outlook for COM stock in the next few days is as follows: - The trend indicators suggest an upward trajectory in the stock price. - Momentum indicators indicate a neutral to slightly bullish sentiment. - Volatility indicators point towards slightly increased volatility. - Volume indicators reflect a mixed sentiment in terms of buying and selling pressure.
Final Recommendation:
Considering the overall analysis, it is likely that COM stock will experience further upward movement in the coming days, supported by positive trend and momentum indicators. However, investors should remain cautious due to the mixed signals from volume indicators and the slightly increased volatility. It is advisable to closely monitor the stock price and key technical levels for potential entry or exit points.
Disclaimer:
This analysis is based on historical data and technical indicators, and it is important to conduct thorough research and consider other fundamental factors before making investment decisions. Market dynamics can change rapidly, so it is recommended to consult with a financial advisor for personalized guidance tailored to your investment goals and risk tolerance level.