Technical Analysis of COPP 2024-05-10
Overview:
In analyzing the technical indicators for COPP stock over the last 5 days, we will delve into the trend, momentum, volatility, and volume indicators to provide a comprehensive outlook on the possible stock price movement in the coming days. By examining these key indicators, we aim to offer valuable insights and predictions for potential investors.
Trend Analysis:
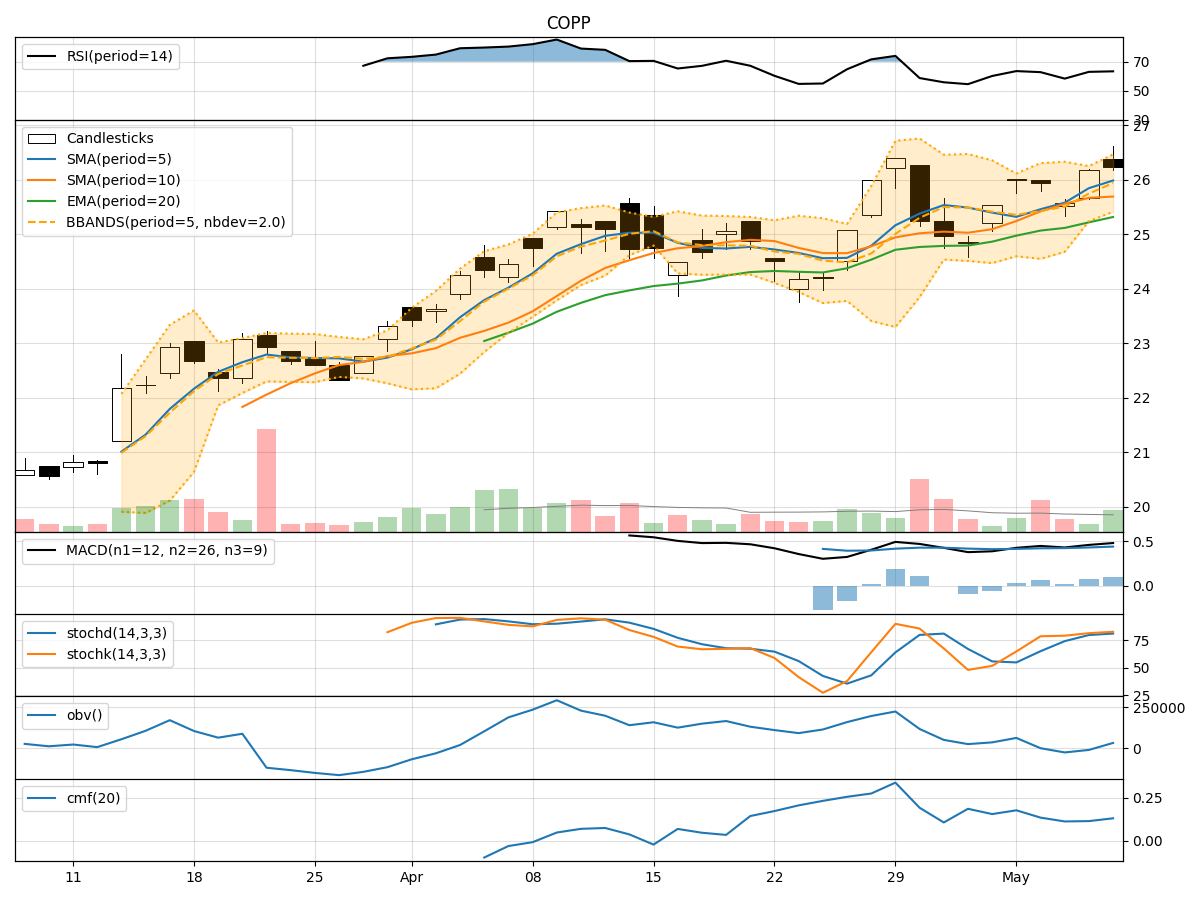
- Moving Averages (MA): The 5-day Moving Average (MA) has been consistently above the Simple Moving Average (SMA) and Exponential Moving Average (EMA), indicating a bullish trend.
- MACD: The MACD line has been consistently above the signal line, suggesting a positive momentum in the stock price.
Momentum Analysis:
- RSI: The Relative Strength Index (RSI) has been hovering around 60-65, indicating a neutral to slightly bullish momentum.
- Stochastic Oscillator: Both %K and %D have been in the overbought zone, suggesting a potential reversal or consolidation.
Volatility Analysis:
- Bollinger Bands (BB): The stock price has been trading within the upper Bollinger Band (BBU), indicating an overbought condition.
Volume Analysis:
- On-Balance Volume (OBV): The OBV has shown mixed signals with fluctuations in volume, indicating indecision among investors.
- Chaikin Money Flow (CMF): The CMF has been positive but relatively flat, suggesting a lack of strong buying or selling pressure.
Key Observations:
- The trend indicators suggest a bullish sentiment in the short term.
- Momentum indicators show a neutral to slightly bullish momentum.
- Volatility indicators point towards an overbought condition.
- Volume indicators reflect mixed signals with no clear direction.
Conclusion:
Based on the analysis of the technical indicators, the next few days' possible stock price movement for COPP is likely to experience a consolidation phase. The bullish trend and momentum may face resistance due to the overbought condition indicated by the volatility indicators. Investors should exercise caution and closely monitor the price action for potential reversals or a continuation of the current trend. A sideways movement or a slight pullback could be anticipated in the coming days.