Technical Analysis of COWS 2024-05-10
Overview:
In analyzing the technical indicators for COWS stock over the last 5 days, we will delve into the trend, momentum, volatility, and volume indicators to provide a comprehensive outlook on the possible stock price movement in the coming days. By examining these key indicators, we aim to offer valuable insights and predictions for potential investors.
Trend Analysis:
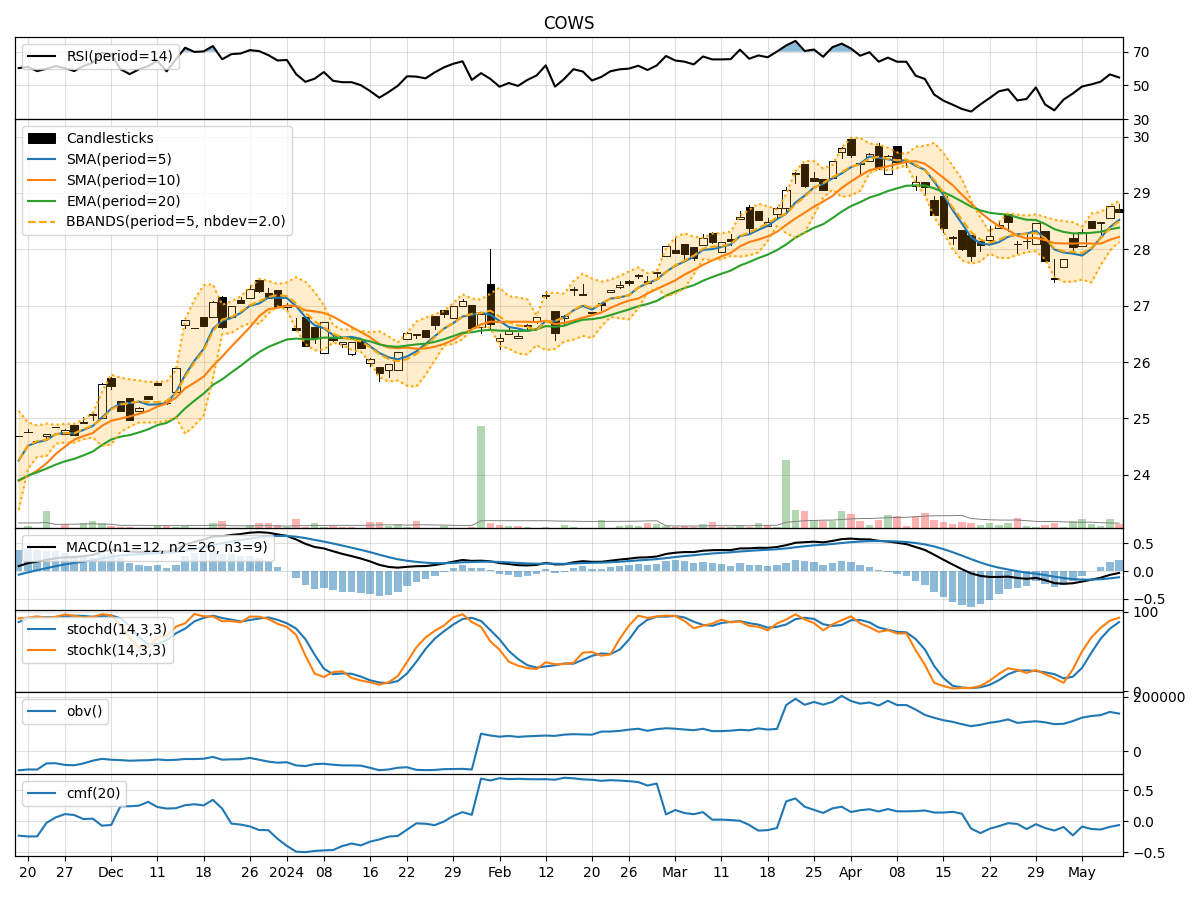
- Moving Averages (MA): The 5-day Moving Average (MA) has been showing an upward trend, indicating a positive momentum in the stock price.
- MACD (Moving Average Convergence Divergence): The MACD has been consistently negative but showing signs of convergence towards the signal line, suggesting a potential reversal in the trend.
- EMA (Exponential Moving Average): The EMA has been gradually increasing, reflecting a bullish sentiment in the short to medium term.
Momentum Analysis:
- RSI (Relative Strength Index): The RSI has been fluctuating around the 50 level, indicating a balanced momentum between buying and selling pressure.
- Stochastic Oscillator: Both %K and %D have been in the overbought zone, suggesting a potential reversal or consolidation phase.
- Williams %R (Willams Percentage Range): The Williams %R has been hovering in the oversold territory, signaling a possible buying opportunity.
Volatility Analysis:
- Bollinger Bands (BB): The Bollinger Bands have been narrowing, indicating decreasing volatility and a potential breakout in the near future.
- Bollinger Band Percentage (BBP): The BBP has been decreasing, suggesting a compression in price movement and a possible period of consolidation.
Volume Analysis:
- On-Balance Volume (OBV): The OBV has been fluctuating, indicating mixed sentiment among investors regarding the stock.
- Chaikin Money Flow (CMF): The CMF has been negative, reflecting a net outflow of money from the stock.
Key Observations:
- The stock is currently in a consolidation phase, as indicated by the narrowing Bollinger Bands and mixed volume indicators.
- The momentum indicators suggest a potential reversal or sideways movement in the stock price.
- The trend indicators show a bullish bias in the short term, supported by the positive EMA and increasing MA.
Conclusion:
Based on the analysis of the technical indicators, the next few days' possible stock price movement for COWS is likely to be sideways with a slight bullish bias. Investors should closely monitor the breakout of the Bollinger Bands for potential trading opportunities. Additionally, keeping an eye on the Stochastic Oscillator and Williams %R for any signs of reversal or continuation of the current trend is crucial. Overall, a cautious approach with a focus on risk management is recommended in the current market environment.